


Jim Hannan (@HoBHannan), Principal Architect
I first started working with Oracle as Unix/Network administrator. Our DBA left for another job and I inherited the database stack. It was supporting an Oracle E-Business stack. Luckily, I worked with Oracle developers that had lots of Oracle experience. My desk was situated in the IT department and across the row of cubicles was the accounting department. In accounts payable sat one of my favorite users, Lois. Lois had a knack for being blunt, but she did it with charm. More times than I can count she would ask from her desk across the row of cubicles “Jimmm why is Oracle so slow?” If you are familiar with Oracle EBS, you know the users primarily interact through Oracle Forms. To the users, when there are performance issues, they typically see an hourglass moving between fields. From a troubleshooting stand point however, that doesn’t help narrow down the issue. Upon hearing Lois, I would open NMON (see our blog for more information on NMON) an OS performance monitoring tool, which would allow me to identify any potential bottlenecks on the database. As DBAs we know it’s not always the database, and I quickly learned that with EBS as well.
Finding Bottlenecks
As a consultant at House of Brick, I often help customers troubleshoot and fix performance issues. I don’t think it is unusual to approach performance issues by starting to look at the database. In fact with Oracle, the database does a good job of telling you where the top bottlenecks exist. So how can we determine if the database is the bottleneck, or if we should be looking at another layer? Let’s look at a simple formula – the total cost of a transaction.
Total transaction time = middleware request + database query + middleware returned results
So if we have a SLA of 5 seconds or less:
5.15 seconds = 0.5 ms + 10 ms + 5 seconds
We can see the tuning opportunity is in the middleware. To find your query cost, use AWR or Statspack to determine execution time.
As Jonas Mason discussed in his blog Oracle Performance Troubleshooting – Part 1, the important first steps in troubleshooting involve narrowing the scope. What’s the bottleneck, and where should the DBA be looking? But what if it is not the database, but is instead an issue with the application or middleware stack? Here are some tools and processes to help identify and fix issues in the middleware stack. I have broken each of the tools into categories, which I will take a closer look at next.
Table 1 – Performance Troubleshooting Tools
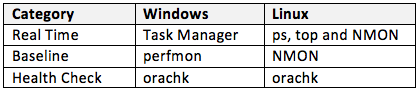
Real time tools are good for quickly identifying potential bottlenecks and narrowing down scope. For Windows, we typically use Task Manager. For Linux, it is typically ps or NMON in interactive mode. For tips on using NMON see our blog. Below is helpful command for identifying the top five processes sorted by CPU.
Figure 1 – ps command
![]()
Figure 2 – Example ps command output
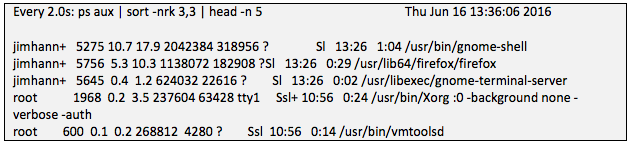
Note: First 4 columns -> user, PID, CPU%, memory%
Performance Baselines
As Jonas Mason discussed in his blog Oracle Performance Troubleshooting – Part 1, having performance baselines is critical for troubleshooting performance issues. It allows you to evaluate what has changed or what the middleware looks like when performance is good. To establish a baseline you should be running some performance collection 24 hours a day, seven days a week. For our deployments, we setup either perfmon for Windows or NMON for Linux, since both have very low overhead and don’t impact performance. In our NMON blog we covered the setup of NMON.
Health Checks and Performance Analysis
Oracle offers a good tool, orachk, for doing health checks and reviewing performance logs for potential problems. The tool can be used on most Oracle middleware products, and on the Oracle database including RAC. Like the baseline tools we recommend, you run orachk while the system is running well in order to get a baseline.
Part 1 Conclusion
As you can see, these tools can give you a holistic look at middleware components and their performance. Next week I will cover how to troubleshoot common Java issues, since we have observed much of our middleware tuning happens in the Java stack.