

Jim Hannan (@HoBHannan), Principal Architect
The nmon utility is a command line performance monitor utility distributed by IBM. Originally created for the AIX operating system, nmon was later ported to Linux. To install NMON, download the most recent version from nmon performance here.
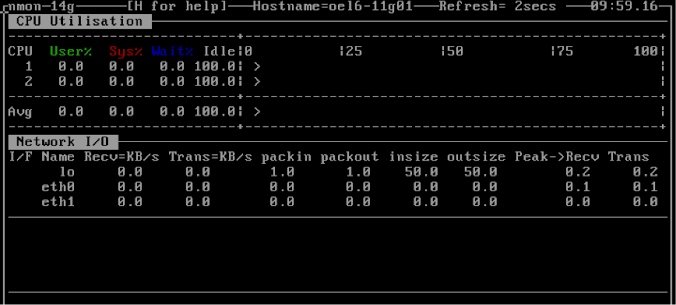
NMON can be run non-interactively or interactively. The screenshot below shows the most common configuration used during testing. In the screenshot below NMON is running with the CPU (type “c” to get CPU) and networking (type “n” to get network metrics) metrics displayed.
Figure 1 – NMON in Interactive Mode
To run NMON in collection mode follow these steps. Copy the zip file to the target server and unzip. The zip file contains runtime binaries for the most common Linux server platforms. Copy the appropriate nmon binary file to /home/oracle/nmon/nmon and change the file permissions to 550. This allows Oracle to run nmon. Set up nmon to capture historical statistics to a file. The following is an example script to capture nmon stats called nmr.sh.
#!/bin/bash
#
# nmr.sh - starts nmon data collection
#
# 00 00 * * * /home/oracle/nmon/nmr.sh > /tmp/nmr.log 2>&1
#
HOSTNAME=`hostname -s`
TIMESTAMP=`date "+%Y%m%d"`
NMONDIR=/home/oracle/nmon/data
NMONFILE=${NMONDIR}/nmon-${HOSTNAME}-${TIMESTAMP}.csv
/home/oracle/nmon/nmon -t -F ${NMONFILE}
find ${NMONDIR} -mtime +7 | grep -v '.gz$' | xargs /bin/gzip > /dev/null 2>&1
find ${NMONDIR} -mtime +60 | xargs /bin/rm -rf > /dev/null 2>&1
Save this script to a file and configure it in cron to start every night at midnight. This process is documented in the scripts comments at the top of the script above. The script is self cleaning, meaning it compresses metrics older than seven days and removes metrics older than 60 days. To generate the NMON report in Excel you first must download the macro called nmon-analyser available here.
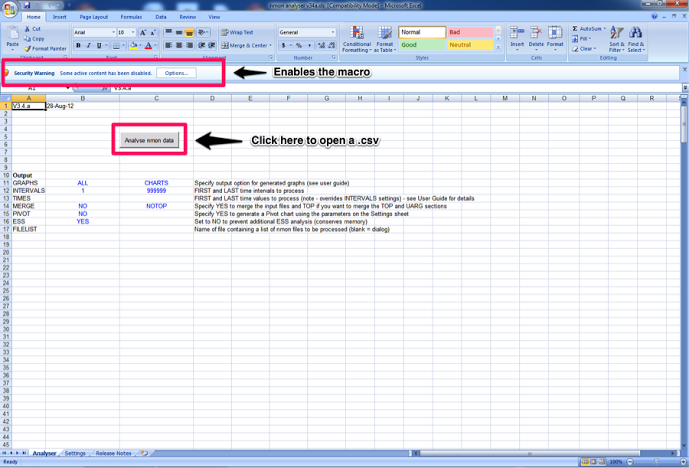
Next double click the Excel macro to open a new document. This will launch the macro and ask for the NMON file to analyze. If you remember deploying the script above you will recall the data folder. The data folder contain one .csv file for each day.
From here the macro can parse one-day worth at a time. It should be noted that you can rollup multiple days worth into one file for analyzing but that process is beyond the scope of this document.
Figure 2 – Opening the macro (nmon-analyser)
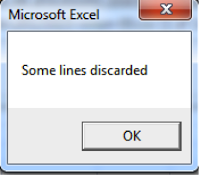
You may receive the message Some lines discarded, see Figure 3. This is due to the binary that runs on the server collecting newer metrics than the nmon-analyser is aware of. This message is safe to ignore.
Figure 3 – Some Lines Discarded
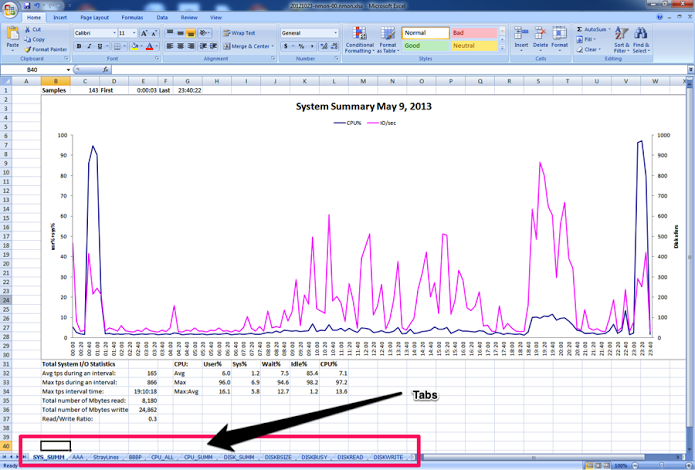
A final note on the NMON report, the report creates tabs separating the collected metrics into categories. Categories include but not limit to I/O, memory, network and kernel.
Figure 4 – Completed Report (notice the tabs)