


Aamir Syed (@sqlevo), Senior Consultant
SQL Server keeps data pages in memory for quicker access rather than reading from disk every time. Now, keep in mind that Page Life Expectancy doesn’t prove or disprove anything on its own. It’s simply a symptom of potential memory pressure. If you think that your server is suffering from some sort of memory pressure, this is just one piece of a bigger puzzle that can help point you in the right direction.
What is Page Life Expectancy?
Essentially, Page Life Expectancy (PLE) is the how long (in seconds) a page of data has been in the buffer pool. SQL Server will always read data from the buffer pool (logical reads). If it can’t find the data page, the engine will perform a physical read to disk and put the page into the buffer pool, and THEN perform a logical read. This is a very simplified overview however, so you can learn more in this Microsoft article.
Physical reads are extremely expensive in terms of performance. It could even be the slowest transition of data within your server, which is why it’s important to reduce and/or eliminate them. Having the proper storage configuration and the optimal amount of memory is very important.
Where do I find PLE Information?
You can find Page Life Expectancy information in the sys.dm_os_performance_counters DMV (a quick Google search can help you find many queries, but it really comes down to a simple select statement). Now keep in mind that PLE can change drastically throughout the course of a day, depending on the server and its workload.
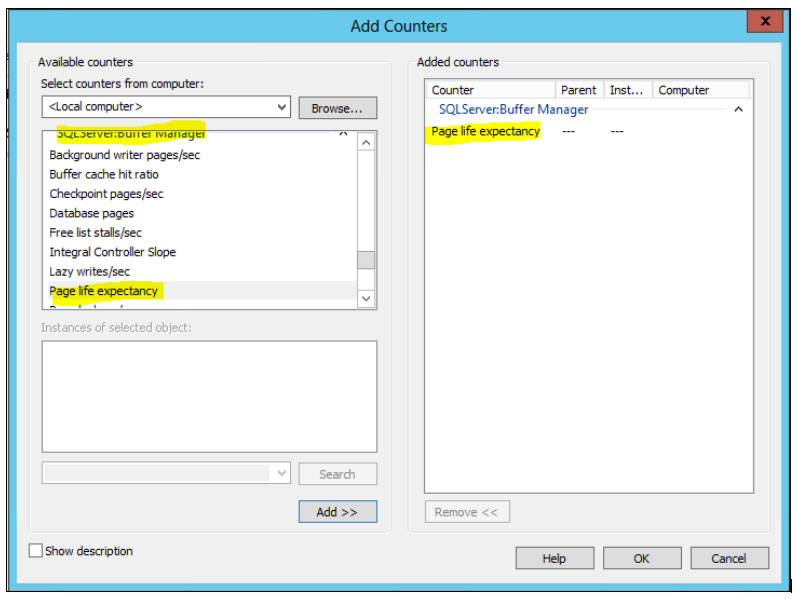
So, in addition to using the aforementioned DMV, I suggest having a Performance Monitor (perfmon) collection setup. (Hint, it’s a great idea to collect perfmon data indefinitely in order to have historical and baseline information). Within Windows Performance Monitor, you can find Page Life Expectancy under the ‘SQL Server: Buffer Manager’ category, as shown in the following image. Keep in mind that if you have a multi NUMA node server, that there will be a PLE counter for each NUMA node. It is important to look into the PLE for each NUMA node in this scenario.
If you have a collection setup, you can look at the historical view of Page Life Expectancy.
For example, you may see a crazy amount of spiking, as shown in the screenshot below.
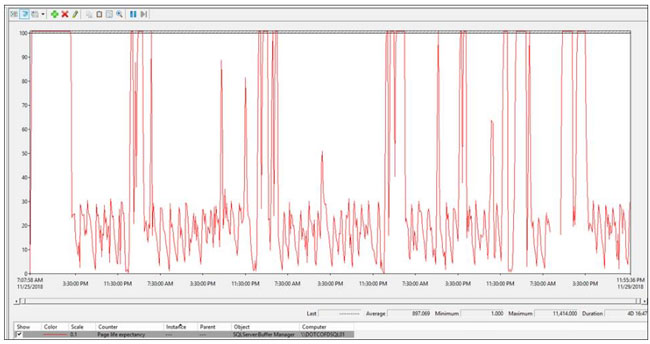
With this, you can see that you’re at the very least, having some type of memory issue. Checking the PLE only once could give an inaccurate assessment of what is going on. Let’s say you capture the PLE number from a moment of “silence” on the SQL Server, you may think that there’s nothing wrong. Looking at a historical view of the Performance Monitor may tell a different story.
For me, it’s not a question of whether I should look in the DMV or in the Performance Monitor, I use both.
How do I know if I have memory pressure?
If you do a quick Google search, you may come across some old posts indicating that a value of 300 sec or under is indicative of a problem. This is outdated information however, which was in reference to old 32-bit servers. Remember, the old 32-bit version of SQL Server was capped at only 4GB of memory.
In recent years, a more accurate number for Page Life Expectancy has been defined by Jonathan Kehayias. Calculating PLE using his formula (Max Server Memory/4GB) * 300 is more accurate, as it is far more dynamic for modern systems and gives you a customized value for the amount of memory that you actually have in your server.
With this more accurate number as to what your server specific Page Life Expectancy should be, you can then view the actual PLE and compare/contrast.
How can I fix my memory issues?
I’ll give you the IT answer…”it depends”. As you’re checking the health of a server, you should be covering all sorts of ground and eventually a story will unfold as to what is ailing the server. So potential solutions may be quite simple, such as running proper maintenance on defragmented indexes. If you have room in your server and your budget, you can think about increasing the memory.
Perhaps the initial setup of the server was fine, but the workload has grown, and nobody noticed that SQL Server simply needed more memory to allocate to its buffer pool.
Speaking of which, you should have a good idea as to what is in your buffer pool. You can read more about in this Microsoft TechNet post.
Other considerations should include some type of index analysis on your databases. You may have a bunch of unused or duplicate indexes that are simply taking up extra space and using valuable I/O every time a write is performed to that specific table.
Perhaps your index maintenance is not efficient enough. Many organizations use the built in maintenance for SQL Server (if anything at all) and it’s simply not effective. At this point, I think we all know that Ola Hallengren offers an excellent and dynamic solution to cover your index maintenance needs. And since his solution is open source, you can customize it any way you like. If you’re really bold (and have a lot of time on your hands), you can go ahead and write your own solution from scratch. But that is usually reserved for special cases in my experience.
Less likely, a procedure cache may be bloated and using up memory that would normally be used for other processes, queries, etc. Look in to options for enabling the ‘Optimize for Adhoc Workloads’ configuration, and maybe even write yourself a custom script that cleans up the procedure cache periodically. This seem like a far-fetched idea, but again, leave no stone unturned.
Sometimes, just plain old query analysis will do the trick. Take a look at the most expensive queries by I/O, CPU, and reads/writes. See if there’s anything that you can do to make them more efficient.
Conclusion
Remember that PLE isn’t the end-all be-all of memory pressure. It’s one symptom that can help lead you in the right direction, but it can also lead you down a rabbit hole. Sometimes the solution for better performance is pretty simple, and other times it requires some really deep analysis, so I urge you to dig deeper and discover what Page Life Expectancy is telling you.