


Jim Hannan (@HoBHannan), Principal Architect
Most DBAs will agree that good performance monitoring and troubleshooting should include OS metrics – in addition to traditional tools like Statspack and AWR. I would speculate that Oracle Support agrees with this notion and that’s why they put together a really great tool called OSWBB.
OS Watcher Black Box (OSWBB1) was formally known as OSW. Why the name the change? Oracle realized many of their tools are already named OSW and decided on a different name to avoid confusion. OSWBB is an OS performance metric collection tool that uses various OS native tools to collect metrics on CPU, memory, storage I/O throughput, and network.
OSWBB is certified to run on the following platforms:
- AIX
- Tru64
- Solaris
- HP-UX
- Linux
With that in mind, this is probably the most attractive feature of the tool, because it runs on so many platforms. This allows you to learn one method for all of your platforms!
Note: In a previous blog we covered NMON, NMON has lots of similarities to OSWBB.
OSWBB also comes with a complementary java utility called OS Watch Black Box Analyzer (OSWBBA2). This tool produces graphs in html of the collected OS metrics. The primary purpose of OSWBB is to be used as a performance-troubleshooting tool. Oracle Support will often ask customers to run the utility when looking into performance issues. The tool can be setup to run at boot3. Additionally, OSWBB is very useful for ad-hoc collections. I discuss setting up OSWBB to do ad-hoc collections in more depth below.
OSWBB has virtually no performance overhead; it costs typically less than 1% of CPU usage when enabled. By default, OSWBB data collection processes collect data every 30 seconds.
To setup OSWBB, first download the TAR files here – document ID 1531223.1.
The download can be simply untarred using:

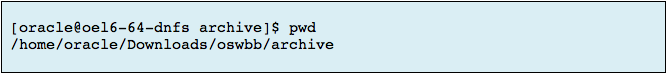
OSWBB collects data and stores it by default in the archive directory underneath the OSWBB home. See example below.
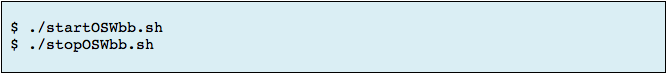
To start OSWBB using the defaults, run the command below (you need to be in the OSWBB home).

The command above will start OSWBB data collection in default mode – 30-second intervals for the next 48 hours. Collection can be stopped by running the command:

There are other options available with the start command. Below is an example of 60-second intervals for the next 10 hours, which compresses the results.

Generally, the defaults are adequate enough for your diagnostic and performance troubleshooting needs. As mentioned previously, the tools are typically run in an ad-hoc fashion with the start and stop scripts (shown below).
OSWBBA
As mentioned previously, OSWBB is a collection tool. OSWBBA is the analyzer that graphs the data collected from OSWBB. OSWBBA is a java utility. It should be noted that the raw data from the collection is kept in the archive folder ($OSWBB_HOME/archive), so it is not always necessary to use OSWBBA. It is also worth noting that some of the collected data is not examined by OSWBBA. (For example: IOSTAT rKB/s and wKB/s.) To use OSWBBA, you need Java 1.4.2 or above. An X Windows environment is also required to render the graphs.

The command above will display the menu of possible reports. The Generate Profile (see bottom of Figure 1) is a report that displays most of the data in one html report. The OSWBB graphs in this post have come from the profile report. After selecting P (as highlighted in the screen shot below), the report is stored in $OSWBB_HOME/profile.
Figure 1 – OSWBBA Report Menu
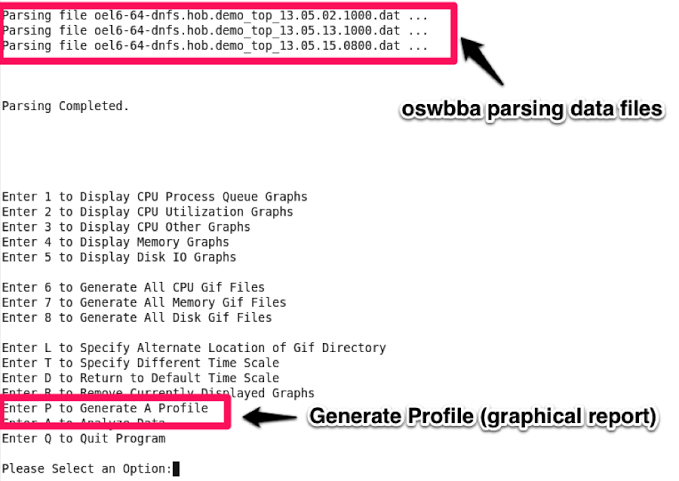
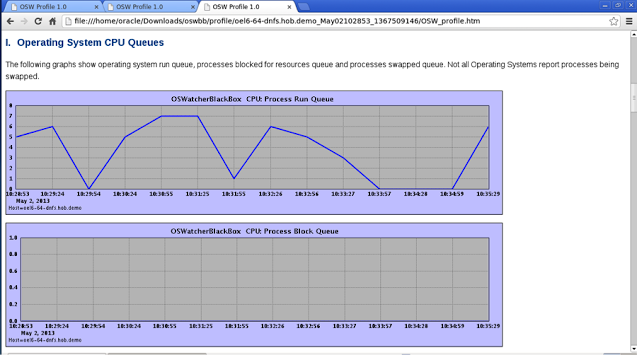
Figure 2 – OSWBB Profile Sample Report
If you have comments or questions find me at @HoBHannan.
1 OS Watcher Black Box User’s Guide [ID 1531223.1]
2 OSWatcher Black Box Analyzer User Guide [ID 461053.1]
3 How To Start OSWatcher Black Box Every System Boot [ID 580513.1]