


Jonas Mason, Senior Consultant
House of Brick consultants assess Tier 1 Oracle workloads using a number of load generating tools and performance reports. In this blog post, I will cover some of the items reviewed in an AWR and Statspack report when performing an initial, cursory assessment of an instance and server before a more involved analysis. The decision to use Statspack or AWR is made based on what the client is licensed for. Using Statspack reports is safest if you are unsure about your Oracle licensing.
Why use AWR or Statspack?
Oracle captures wait events associated with database activity that help the DBA understand what resources are being consumed and utilized by an instance as a result of SQL execution, statistics gathering or RMAN backups. If multiple instances are on a single server, server resource utilization alone (as reported through nmon or OSW) does not provide the most complete view or answer the question of which instance is responsible for load. Per instance findings, based on AWR reports, can be useful when recommending that an instance be hosted on a dedicated server instead of competing with other instances.
Comparing past performance to current performance provides trending information that can be useful for right sizing purposes. By identifying and clearly articulating instance activity, the DBA can recommend infrastructure improvements and purchases that are budget conscious. Analysis is undertaken primarily to justify to the business what its Oracle system needs are and are not. While an over provisioned system may meet instance requirements easily, the additional costs for hardware and Oracle licensing could take an unnecessary bite out of business profits.
Review Period
When assessing workloads we want to make sure the client is providing us reports based on peak periods of activity for its most critical processes. This should include all types of peak activity, whether this is the result of user transactions, reports, batch jobs, RMAN backups or statistics gathering. The time periods should include weekly, monthly, quarterly and year-end activity if possible. Typically some compromise is made, as this information is not always readily available. Reviewing server utilization metrics captured by OSW, nmon, or Enterprise Manager prior to AWR analysis can facilitate identifying peak activity and help to avoid parsing through AWR/statspack reports in order to identify peaks. I typically discard AWR reports that do not represent peak activity to save analysis time.
Snapshot Interval
AWR and statspack reports are generated based on snapshots of time that are defined by a job, or generated ad hoc. The default snapshot interval of an hour for AWR and statspack is useful when beginning a system assessment, but does present the risk of averaging out a spike in resource utilization that may have only lasted minutes. Since the goal in this blog is to assess peaks associated with actual Tier 1 workloads, the more granular the time period analyzed the better. Snapshots can be setup to capture 10-minute increments for this purpose. Reports with an hour rollup period can still be generated for determining peak periods during the day; however, further granular analysis is enabled since the smaller snapshot periods are stored.
DB Time
DB Time is measured from the beginning of a snapshot interval to the end of a snapshot interval and primarily represents the amount of time the database spent responding to SQL statements. There are thousands of wait events that may be encountered. DB Time that is significantly less than the elapsed time of the snapshot period indicates an instance that is relatively idle. DB Time that is the same, or more, than the elapsed time during the analysis period indicates a more active instance. This is a very high level finding and is useful insofar as when DB Time is insignificant and no further analysis is required. Since DB Time encompasses all activity on a database, it is a good general indicator of overall database activity, but is not that useful for server sizing.
CPU Assessment
Report Summary Load Profile: Logical Reads
Logical reads per second in the load profile section provide an indication of work performed by the CPU, as these are blocks read in memory. Logical reads per second of under 50,000 does not indicate much CPU utilization and the instance may be more transactional. Logical reads for decision support and data warehouse instances are between 100K and 1M. Batch jobs for transactional systems can certainly drive high logical reads for periods of time.
Why is this metric helpful? There would be no reason to request higher performing and/or additional CPU on a server if the peak value for this metric was relatively low for all instances. The real bottleneck to performance may exist elsewhere and could require more attention. With Oracle licensing costs being contingent on CPU counts, over allocating this resource gets very expensive quickly. Our approach is to give the instance the CPU it needs and not over allocate.
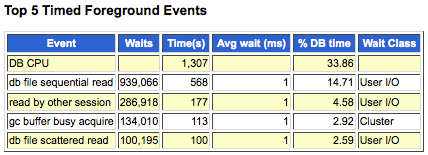
Report Summary: Top 5 Timed Foreground Events
This portion of the report is valuable in terms of specifying what wait events make up DB Time. This is important in specifying just what the database instance is spending time on and what server improvements might help. Also be sure to note that just because one of these values may consume 90% of DB Time does not necessarily indicate a problem, especially if overall DB Time is low.
In the example below, we see that CPU consumes 33% of DB Time and for the hour period, resulted in 1,307 seconds of utilization. We also see that 23% of DB Time was consumed by the Wait Class User I/O and relates to disk reads. In this case, activity is rather minimal and the combined wait times are insignificant.
Storage Assessment
Load Profile: Block Changes Per Second
Block changes per second indicate the rate at which blocks are being modified in underlying datafiles. This is important in determining the impact of DML on datafiles and how much writes are driving load. While not as useful as other metrics in determining IO requirements, it does give an indication of the type of loads being generated.
Load Profile: Physical Reads and Writes Per Second
These two metrics in the load profile are important in getting a sense of the ratio of disk reads to disk writes. If physical reads are significant relative to logical reads, an increase in the SGA may help reduce physical reads. A review of the SGA Target Advisory will confirm this. If physical writes per second are significant, more attention needs to be paid to storage latency in what is a more DML heavy system.
Instance Activity Stats: IOPS and MB/s
Getting a sense of the max read and write Disk Input/Output Per Second (IOPS) and max read and write throughput (MB/s) generated by an instance is useful in determining if a new storage array can handle a perceived load, or whether the current array is sufficient. In the instance activity section of the AWR report, the following metrics clearly indicate this information:
- Physical write total IO requests
- Physical write total bytes
- Physical read total IO requests
- Physical read total bytes
When reviewing these metrics, be sure to reference the per Second column and not use physical write IO requests, physical write bytes, physical read IO requests and physical read bytes. It is only the totals for these metrics, per second, that we are interested in for this exercise, as they provide a complete picture of IO.
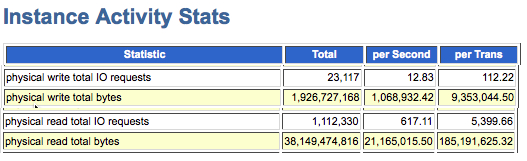
Physical read total IO requests in this example is 617 and physical write total IO requests is 12. The physical read and write rates translate to 20 MB/s and 1 MB/s respectively and are rather insignificant considering the throughput possible with enterprise class storage. However, storage vendors find these metrics useful for right sizing a new system, or troubleshooting an existing system.
Coupled with a test such as calibrate_io, the DBA can determine if instance activity is approaching the maximum read throughput and IOPS possible from within the Oracle kernel. If migrating to a new system, calibrate_io can be executed to determine if it will meet the peak read rates represented by the AWR report.
Memory
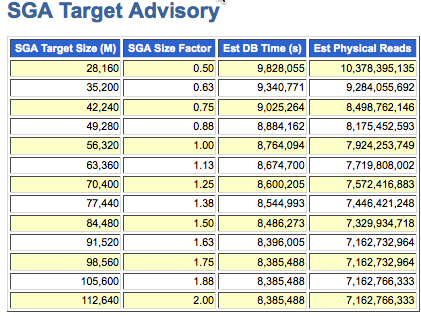
SGA Target Advisory
The SGA Target Advisory is an easy way to determine if more memory for your instance and server may be necessary. The instance we are looking at in the example below has 56 GB allocated to SGA. What we are looking for is a significant decrease in the reduction of estimated DB Time and estimated physical reads with an increased SGA size. In this case, doubling the SGA size to 112 GB does not result in a significant decrease in DB Time or physical reads. Leaving the SGA set at 56 GB is sufficient for this instance; tuning SQL statements might yield better results in terms of reducing physical reads and response time.
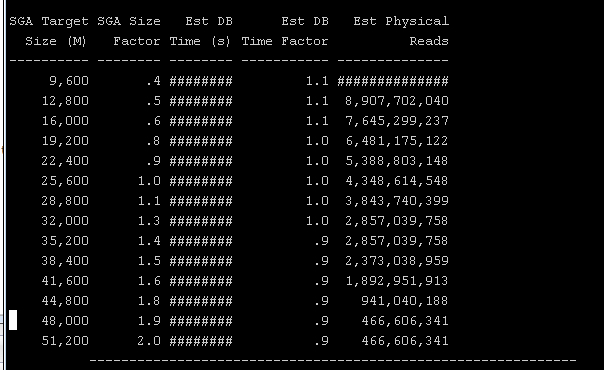
In another example of the SGA Target Advisory in statspack for another instance we can clearly see that increasing the SGA from 25 GB to 48 GB results in a significant reduction in physical reads. This increase in SGA memory should reduce load on the storage array. It is also important to note that despite increasing SGA in this case, the impact on DB Time is less significant as the storage is high performing. In this case, the cost of memory has to be balanced with the cost of storage when making a decision to increase the SGA.
Conclusion
This blog presents a high level overview of some of the initial AWR and statspack items reviewed when assessing system performance and the utilization of server resources such as memory, CPU and disk IO. This initial review, which only begins to scratch the surface of what is available to analyze in an AWR report, can be useful for right sizing a new server based on legacy performance trends, or tuning an existing instance to perform better. Historical reports can be useful in troubleshooting current problems as they help answer “what changed?” questions. If an instance all of a sudden is consuming far more CPU or storage array resources than before, additional analysis can be more focused with a deeper dive into the top SQL statements responsible for underlying system degradation.