


Jonas Mason, Senior Consultant
In my blog post Troubleshooting Oracle Performance – Part 1, I covered initial troubleshooting steps when narrowing the scope associated with a general Oracle performance complaint. I introduced the Method R approach to tuning, which focuses on improving response times for statements and processes most important to the business. The role of the Oracle Wait Interface was reviewed as it is critical to interpreting and optimizing explain plans for SQL statements. Tuning for the most significant wait events in an explain plan yields the greatest improvement. The end goal of this series is to provide a technical framework and methodology that facilitates the resolution of a performance problem through DBA, developer and end user cooperation.
This blog post builds on Part 1 by providing Oracle session views, statspack SQL sections, and table and index statistics that help DBAs and developers understand the background to why a statement is performing poorly. I briefly review the top SQL statements section in a statspack report. In order to tune a SQL statement, it is important to understand why it is performing poorly first.
This blog draws heavily from the books below, which are recommended reading:
- Richmond Shee, Oracle Wait I interface: A Practical Guide to Performance Diagnostics and Tuning (Oracle Press Series) (More System/Session Related)
- Cary Millsap, Optimizing Oracle Performance (O’Reilly Media Inc.)
Session Related Wait Events
Understanding what server resources are consumed, and what Oracle wait events are being encountered at the system level, can provide valuable background if the snapshot is limited to the problem period identified by the end user. However, server and instance level wait metrics do not provide the complete picture. In order to get a more detailed picture of the activity and performance issues within an instance, session activity must be reviewed as well.
Reviewing session related wait events gets us closer to helping our end user, per the Method R approach, as the scope is at the session level for the time period the user is having issues.
We want to see which sessions in our instance are most active, out of all active sessions. If we can view activity for the session while it is happening, we can get a good idea of what that user is waiting on, or if other instance activity from another sessions is a culprit. If you can troubleshoot a problem with a user session while it is occurring, you will have more success identifying the problem SQL statement.
Statistics per the V$SESSION_EVENT view is useful if you have a username and can determine the SID of the user session.
select b.sid,
 decode(b.username,null,substr(b.program,18),b.username) username,
 a.event,
 a.total_waits,
 a.total_timeouts,
 a.time_waited,
 a.average_wait,
 a.max_wait,
 a.time_waited_micro
 from v$session_event a, v$session b
 where b.sid = a.sid
 order by 1,time_waited desc ;
These metrics are useful to determine the waits a session is encountering. While the narrowing of scope to sessions is valuable, drilling in further to the SQL statements executed by the session is our ultimate goal.
Session Related Wait Events – Real Time Activity
If a user is experiencing a problem with a current active session, it can be useful to see what that session is waiting on, in real time.
select b.username,
 a.wait_class,
 a.event,
 a.seconds_in_wait,
 a.state
 from V$SESSION_WAIT a, v$session b
 where a.sid = b.sid order by b.username ;
If you have the Session ID (SID) or username, modify the where clause to view activity for that SID or user only. If not, peruse the query output for the user experiencing the slowest response times.
Reviewing SQL Responsible Culpable SQL
The steps I have taken so far provide some indication of wait events encountered at the session level. The purpose of this exercise is to identify what to look at more closely, which is often a SQL statement. If explain plan and cost are insignificant, a closer look at the system might be in order. If the explain plan and cost are significant, there may be an opportunity for tuning. And if not tuning, then at least an appreciation is gained for what kind of resources a particular instance might require, and how to better right size a server.
Statspack, AWR reports, Enterprise Manager, and other performance monitoring tools are often very good at identifying poorly performing SQL statements. Whether or not those identified statements are impacting our end user is another question that must be confirmed using the Method R approach. If DBAs and developers wanted to tackle all top resource consumers as identified by these methods and were successful, overall utilization of CPU and disk I/O would likely drop and benefit the system as a whole. While this is a great thing, we didn’t necessarily help our end user whose session, or SQL related issue, might not have been directly addressed per Method R.
By considering the sections below from a statspack report, during the time frame the user has complained about performance, DBAs and developers can get a sense of what was happening on the system during that time, and how a user’s complaint fits into the overall snapshot of Oracle instance activity.
If the case of using statspack, review the following sections for top SQL resource consumers:
- SQL ordered by CPU
- SQL ordered by elapsed time
- SQL ordered by gets
- SQL ordered by reads
- SQL ordered by executions
Within each of these sections, the same SQL statement often appears, because SQL that consumes a lot of CPU likely has higher buffer get rates and physical disk read rates and probably takes longer to execute.
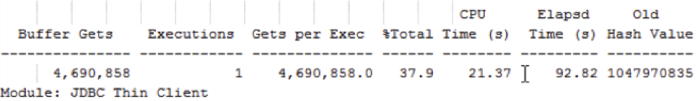
Figure 1 below is an example from the section SQL ordered by gets that describes the cost associated with a SQL statement, for a one-hour snapshot period. It was responsible for 37.9% of DB Time. In this example, overall load on the system was low. While a single execution that resulted in 4.6M buffer gets is expensive and does represent a significant portion of DB Time, the system in general is healthy and has plenty of available bandwidth to handle this statement. Even though this statement is consuming a lot of resources, it is not necessarily impacting our end user if the statement and session is not hers. If this is our user’s SQL, then we can start tuning.
If this is a report, which it probably is, then the question to the end user would be what is an acceptable execution time? How much faster was it executing in the past? As a DBA, I would want to know if the frequency of execution would ramp up significantly.
If this statement were executed 100 times an hour, server resource utilization would certainly increase. The system might be able to handle 100 executions an hour, but what happens to performance as underlying tables also increase in size? The overhead associated with joining records of constantly growing tables often results in increases to gets per execution as time passes. This typically translates into more disk reads, logical reads and CPU utilization. If you have 10s or 100s of expensive statements, such as the one identified in your instance being executed, often enough you will have a clear idea of why resource utilization is so significant.
Ideally, explain plans associated with SQL statements are robust, in that they do not increase much in cost despite underlying table and index record increases and large storage footprints. This would be the ideal goal of a well constructed SQL statement, or a SQL statement that is properly tune:
Figure 1: SQL Ordered by Gets
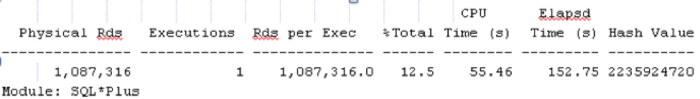
In Figure 2 below, statements are ordered based on physical reads required per execution.
Figure 2: SQL Ordered by Reads
SQL statements listed as top consumers in the statspack report explain the source of the load you are seeing in the Statspack Load Profile section. Once the SQL is identified through a review of the statspack report, or querying some of the views presented, you can then focus on what really matters, which is improving SQL response times by searching for better explain plans. In these sections, the SQL statement is usually shown in part. However, I removed these references from the screenshots.
Tables and Index Statistics
When reviewing an existing SQL statement or considering creating a new SQL statement, it is useful to know the size of the table you are selecting, updating or deleting from, and the data skews for columns within that table. Data skews for the columns used to join multiple tables are especially important. This data informs select statement syntax, table joins, and index creation, and the Oracle Optimizer uses these statistics to generate an explain plan. These explain plans have a significant impact on the way records are read and processed prior to returning a result to the end user.
The query below against dba_segments and dba_tables provides some high level information about the tables we are accessing in our SQL statements. It is important to consider the size of the table now as well as over the course of the table’s lifetime. Failure to properly consider table growth accounts for a significant number of performance related issues, especially when tables are joined inefficiently.
Select a.owner,
 segment_name,
 segment_type,
 num_rows,
 bytes / num_rows bytes_per_row,
 bytes / 1024 / 1024 meg,
 bytes / 1024 / 1024 / 1024 gig,
 SYSDATE AS INSERTED_DTS
 FROM dba_segments s, dba_TABLES a
 WHERE     segment_type = 'TABLE'
 AND a.TABLE_name = s.segment_name
 AND a.OWNER = s.OWNER
 AND bytes > 0
 AND num_rows > 0
 ORDER BY Meg DESC
 /
Below are similar statistics for indexes:
SELECT A.OWNER,
 segment_name,
 segment_type,
 num_rows,
 bytes / num_rows bytes_per_row,
 bytes / 1024 / 1024 meg,
 bytes / 1024 / 1024 / 1024 gig,
 SYSDATE AS INSERTED_DTS
 FROM dba_segments s, dba_indexes a
 WHERE     segment_type = 'INDEX'
 AND a.index_name = s.segment_name
 AND a.OWNER = s.OWNER
 AND bytes > 0
 AND num_rows > 0
 ORDER BY Meg DESC
From a performance viewpoint, it is useful to have these table and index statistics when troubleshooting why a statement is performing poorly.
Scheduling the collection of the metrics above into a table with a timestamp column is useful when trending table record count and storage utilization growth over time. Details can be provided to the business on how much storage is needed, when, and why.
In the next part of this series I will cover reading explain plans, query diagramming, and tuning methods.
References:
Shee, Richmond and Kirtikumar Deshpande, K. Gopalakrishnan Oracle Wait Interface: A Practical Guide to Performance Diagnostics and Tuning (Oracle Press Series) (More System/Session Related) 2004
Millsap, Cary and Jeff Holt Optimizing Oracle Performance Boston: O’Reilly Media Inc., 2003