


House of Brick Principal Architect
Recently, House of Brick completed a project where the client was looking to replace an aging SQL Server 2008 server running on an Itanium CPU platform. They did not want to purchase a new Itanium server due to application and operating system support, and were strongly considering virtualizing the new environment. Since that’s our sweet spot here at House of Brick, they called us to guide them through the process. They were also evaluating x86 hardware from two competing vendors. The client asked that comparative performance testing take place so that the hardware could be evaluated as part of the project.
Of course, SQL Server on x86 VMware worked beautifully, but some of the findings in this project might surprise you. This blog post outlines the details of the project, as well as the outcomes of the various tasks.
Platforms
The names of the vendors shall not be disclosed in order to protect the innocent.
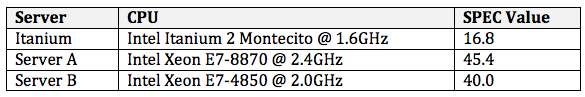
The Itanium server contained eight Itanium cores running at 1.6GHz each.
x86 Vendor A’s server (to be referred to as Server A) contained four Intel Xeon E7-8870 CPUs, each with ten cores running at 2.4 GHz. It contained 512GB of RAM.
X86 Vendor B’s server (to be referred to as Server B) contained four Intel Xeon E7-4850 CPUs, each with ten cores running at 2.0 GHz. It also contained 512GB of RAM.
All servers contained two 8Gb fibre HBAs with a 4Gb limited connection to the same SAN, an EMC DMX4 with 32 spindles per 500GB LUN, and 128GB of controller cache. PowerPath and PowerPath VE were installed in their respective environments.
Comparing these CPUs with the SPEC CPU2006 benchmarks yielded unsurprising results given the age of the Itanium CPUs.
But, as we all know, individual synthetic benchmarks rarely tell the whole story.
VMware
VMware vSphere 5.0 U1 was installed on the two servers. Both were configured identically with all performance best practices in mind. Both were connected to the same LUNs on the same SAN. A single VM was created. A two vSocket x four vCore VM was created with 128GB of vRAM and 3TB of VMDK-backed virtual disks was created. This configuration matched the production Itanium server as closely as possible. SQL Server 2008R2 was installed on this VM with all of our usual performance best practices applied into the template.
VMware Showdown
First, we wanted to see if any performance differences were present between the two x86 VMware hosts. Both storage and synthetic SQL Server benchmarks were used to compare performance. The Itanium platform was also evaluated to determine the production baseline and the anticipated x86 performance improvement values.
At the end of the tests, the VMware hosts were wiped and Windows Server 2008R2 installed. The same tests were rerun to show the virtualization performance wedge.
Storage Tests
A 50GB SQLIO workload (equivalent to the customer’s average database size) was placed on the VM, hosted by Server A. House of Brick’s workload test was used to execute various disk loads, and the results were analyzed. The server was then retested after the Windows Server 2008R2 was installed native to the hardware and then evaluated.
A strange thing happened. VMware as a platform with Windows Server 2008R2 running inside a virtual machine performed an average of 10% faster than the same server with the same SAN when configured with just Windows Server 2008R2 as the host operating system. If you would like the raw numbers, contact me and I will be happy to prepare them for you.
The performance improvement of VMware over the native environment is surprising. Ordinarily, in a test such as this one where the hardware and the Windows server configuration are identical, VMware’s performance is equivalent. To have VMware outperform native is unusual. One theory about the performance difference attributes this improvement to faulty or below-average performing HBA drivers for Windows.
Next, a quick test was also performed to determine the negative effects of a greater intensity workload that could flush the SAN controller cache more frequently, which in turn will negatively affect performance. A 200GB workload was configured and the SQLIO tests rerun.
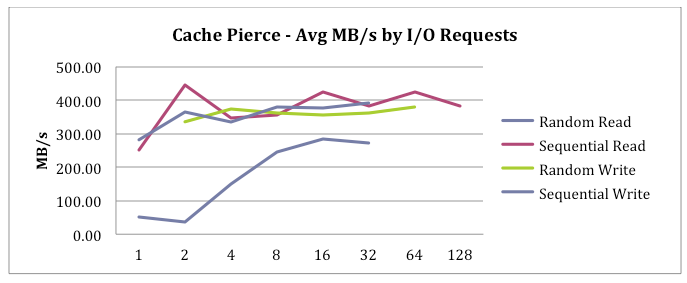
The following chart demonstrates the performance effects of piercing the SAN controller read/write cache. Essentially, this chart shows the effects of very high I/O on the SAN and what happens when the array is struggling to keep up with disk reads, writes, and cache flushes due to overloaded cache memory.
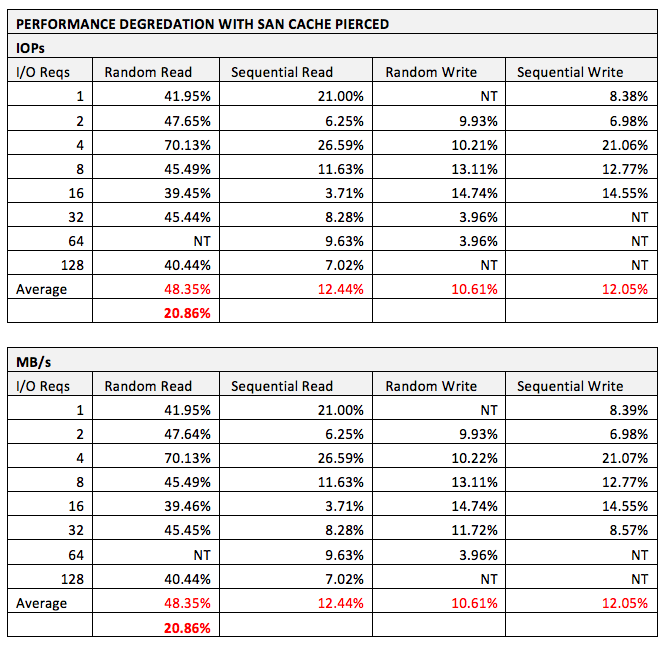
The analysis demonstrates a relatively minor (21%) degradation in performance when the SAN cache has been saturated and the workload is mostly running directly on the underlying disks. This is a good number, since it indicates that the disk system under the cache was very solid and robust and could withstand cache saturation without severe impact to overall performance.
Server A and Server B were then comparison tested by starting a SQLIO workload on Server A, and measuring the output. The VM was then vMotioned to Server B and the identical workload was rerun. Technically, Server B outperformed Server A by an average of 147.5 IOPs and 9.22MB/s average across all tests. However, with background traffic, different times of day and days of the week, and an IOPs range of over 7500 and throughput peak of over 500MB/s throughout the tests, these differences are negligible. Overall, these servers are performing equivalently with regards to storage performance on the same shared storage.
Next, the Itanium was benchmarked to determine the performance of the server when connected to the same SAN. The results were troubling.
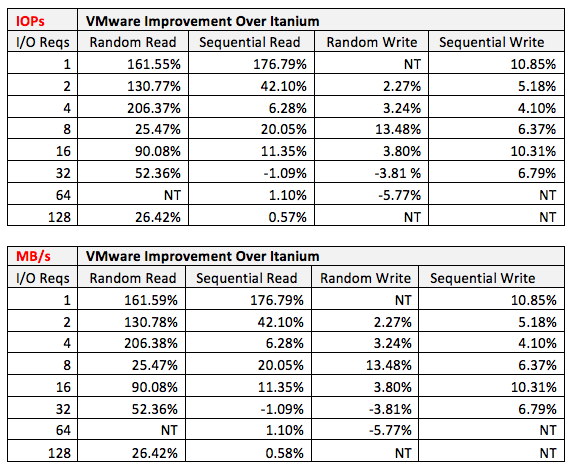
The two systems were connected the same SAN used the same speed interconnects, and used the same tests. The performance differences are significant. Theories about the performance degradation on the Itanium platform include immature HBA drivers, background processing from the production environment, partition alignment, or other items surrounding the Itanium platform itself. We were not allowed to dig deeper into this mystery, but my assumption is that a storage-related subsystem or driver was poorly written and bottlenecking the system.
The bottom line is that in almost all cases, storage performance of the POC VMware environment exceeded that of the production Itanium environment.
VMware High Availability (HA)
The next test was to determine the SQL Server service restart time in the event of a host failure and a VM gets restarted on a different host. With a 3TB load of SQL Server databases on the VM and the VM located on Server B, Server B was powered off and VMware HA performed its magic. The total downtime of the SQL Server service was measured from the time of the power-off operation to the time the SQL Server service was back up and accepting connections again.
Three tests were performed. The SQL Server service was back up and listening in 4m 24s, 4m 43s, and 4m 38s, respectively.
SQL Server Instance Performance Using DVDStore
DVDStore is a freely available database benchmarking utility available from Dell at http://linux.dell.com/dvdstore. It will create a synthetic database workload on SQL Server, Oracle, MySQL, and PostgreSQL database systems. This tool stress tests the database platform, and therefore tests CPU, memory, and disk performance as a whole.
A sample workload of 50GB was created in the virtual machine to test the SQL Server configuration performance. The output is in the form of orders placed per time period.
MaxDOP was configured from 1-6 and the number of threads increased per test. The test, like the storage test, was run on Server A. The database was restored, the VM vMotioned to Server B, the VM rebooted, and the test rerun.
Note: Here is where the interesting results appeared. Remember the differences in Xeon CPUs? The SPECINT results showed a 20% raw CPU improvement between the two classes of CPU. Server A’s CPUs ran at 2.0GHz and Server B’s at 2.4GHz. The results from the test are shown below.
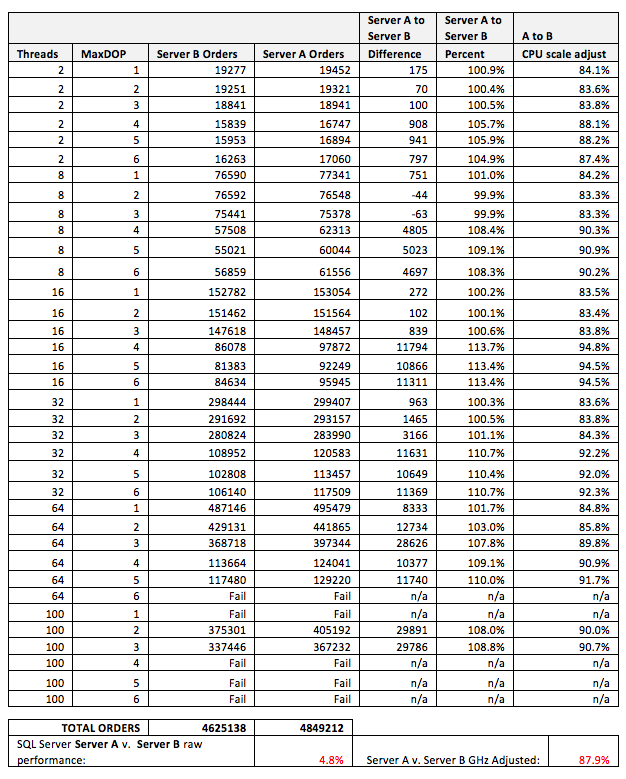
Look at the final result. Only a 4.8% difference was observed. Let’s explore these findings a bit deeper. We experienced a 4.8% improvement in performance with CPUs rated at 20% faster. If you scale the results to match CPU speeds, vendor B’s hardware was actually 12% faster! I find the differences in hardware platforms fascinating, and especially so when the majority of the components (i.e. memory, CPU vendor, etc.) are the same.
The same set of tests was performed on the production Itanium server and the results compared.
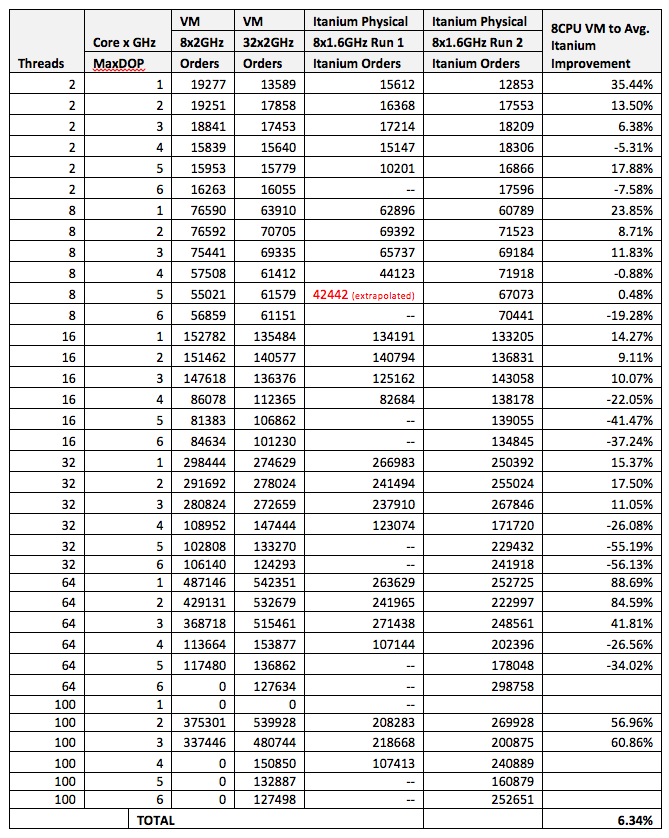
Three items on this chart pop out at me.
First, the numbers that I was interested in, the results from MaxDOP = 1, showed that the VMs had a 40% performance improvement over the Itanium servers at that configuration. The client had a requirement that the current production server used MaxDOP = 1.
Second, as MaxDOP increased, the Itanium processors performed increasingly well against the Xeon processors. It had been architected for exceptional parallel workloads, and the results clearly back this architectural decision up.
Third, we have proof that over allocating VM vCPUs slows a VM’s performance.
Right Size Your VMs
Examine the results closely, and you will see that with the same synthetic workload, scheduling idle CPU activity contributes to performance degradation. Let’s extract the relevant data here.
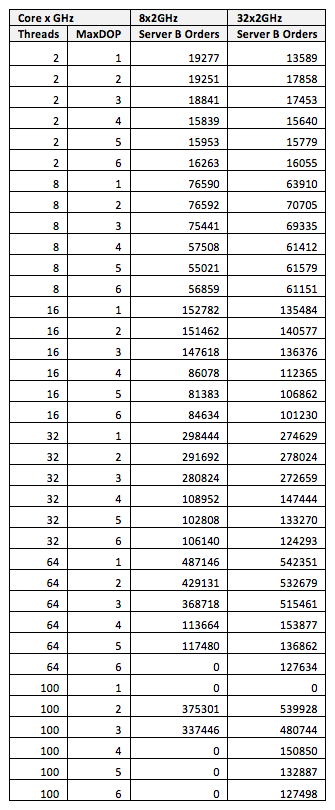
You can clearly see that more vCPUs on a workload that are not actively utilizing all cores will reduce performance of the VM.
The DVDStore tests were run with the same VM in an 8-vCPU and then again in a 32-vCPU configuration, aligned by NUMA nodes.
Until the workload grows to actively use all available vCPUs, the performance was actually worse. Once the workload increased after MaxDOP = 3, the 32-vCPU VM takes off and far surpasses the performance of the other configuration. I know that it is counterintuitive, but this fact is that “right-sizing” your virtual machines — or only allocating the resources that are needed — is so important. Even more important is your need to baseline your environment to measure the resource utilization on your servers. You have to know how much CPU to actually allocate to a VM. You DO have system baselines, don’t you?
Conclusions
So, what can we draw from this case study?
At the same vCPU configuration, the VMware environment outperformed the Itanium environment.
VMware versus a native physical configuration on the same hardware showed that the virtualization overhead was functionally negligible and that performance was at least equivalent and sometimes greater than that of its physical counterpart.
Not all vendor hardware with equivalent CPUs perform at the same functional speed.
Right-sizing your virtual machines can actually improve performance.
This project was a fantastic way to explore the Itanium architecture, its benefits and its weaknesses, and once again prove that virtualized mission-critical workloads should be an assumption and not a special project or discussion point.