


This is part 1 of a 2-part blog series.
TempDB is a global database used by everything inside of SQL Server. It works in a round-robin fashion amongst the files that have been allocated to it. It is non-durable and clears its used space once processes are finished using it.
As DBAs we usually do not have to worry about TempDB, however on occasion we will receive a drive space alert only to find that tempDB has grown and used up all its allocated drive space (yet another reason that your TempDB should be sitting on its own separate drive).
Upon logging in, you might find that while the physical Tempdb files are large, the actual space used within in the files have already cleared leaving much of TempDB as free space. This is good because you can just shrink the files to reclaim the physical drive space. However, because the process has already finished you cannot identify what caused this to happen.
In our line of work, if this happens enough, end users, app owners and managers would like to know the root cause of the problem. Here at House of Brick, we have had much success finding these queries by using extended events.
How to use Extended Events to identify queries:
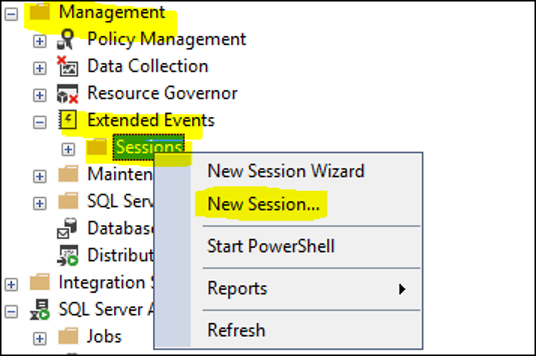
Create a new Extended Events session by opening up SSMS -> Management -> Extended Events. Right click on “sessions” and create a “New Session”:
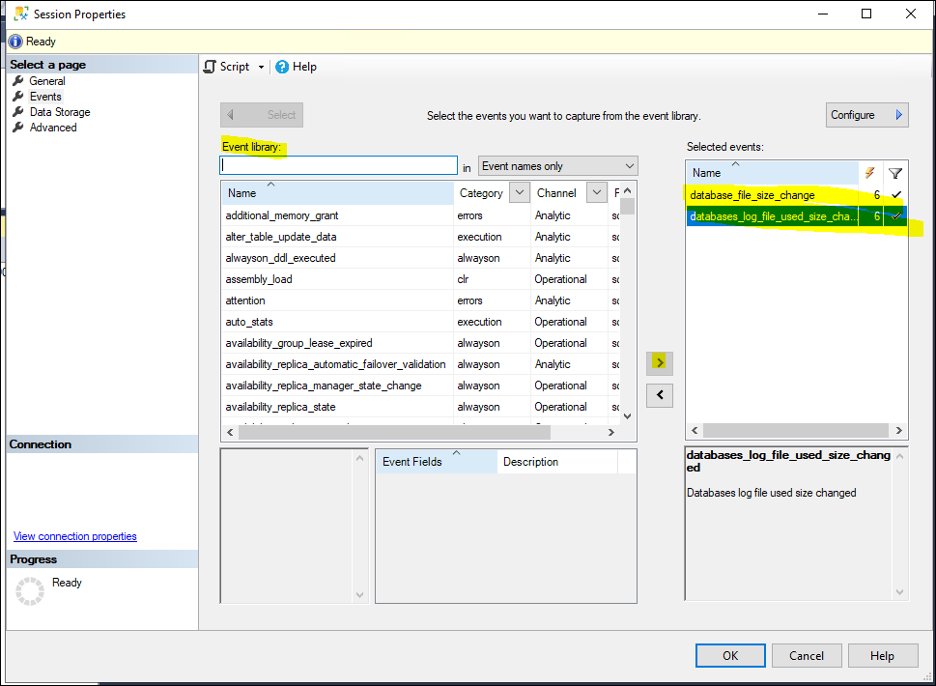
Select the following events:
Database_file_size_change
database_log_file_used_size_change
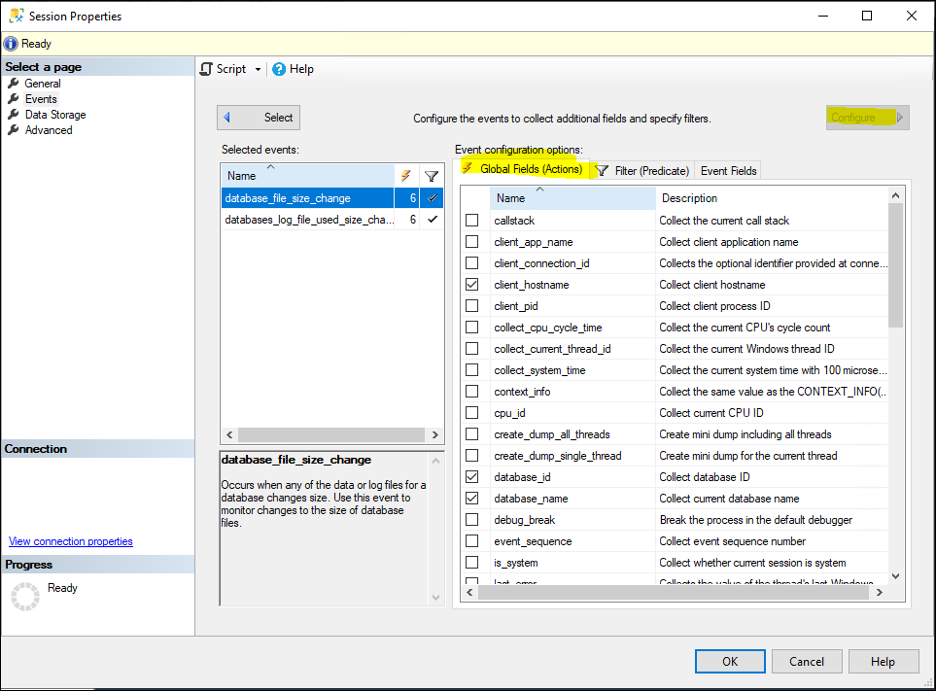
Go to “Configure” and select the following global fields:
client_hostname
database_id
Database_name
Sql_text
Username
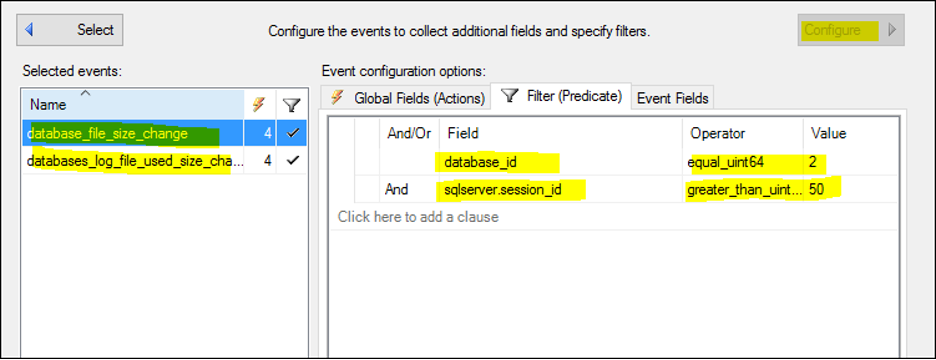
In the “Filter Predicate” select the database_id equal to “2” (this is the db_id for TempDB ) and the sqlserver.session_id to greater than 50 (to only capture relevant connections). Do this for both events that we selected.
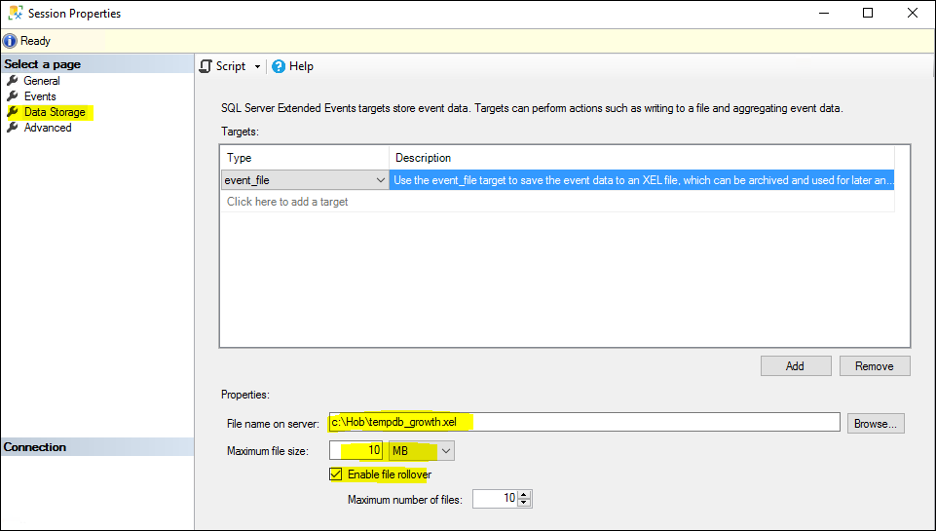
Under Data Storage select event file and browse to where you want to save the .xel file. (Please see highlighted sections).
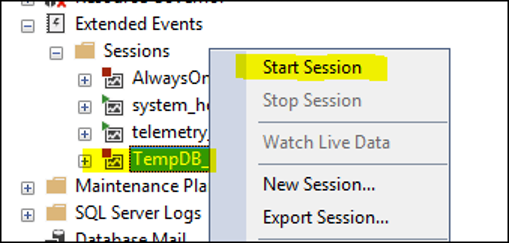
Press “OK” to finish the setup. Once it is complete, right click and select “start session” to begin collecting data.
In part two, we will show you how to analyze the data to find the culprit.