


Dave Welch (@OraVBCA), CTO and Chief Evangelist
Storage Performance Metrics
This blog entry is the continuation of the blog entry dated August 5, 2011
Average Read Time
20ms
Sustained peaks of >20ms for no more than about five minutes
Attributes:
Un-cached random reads
Assuming 90% read, 10% write, with writes colliding
The Average Read Time performance attribute is important because there are schema/application designs that can pierce the cache, regardless of how big that cache is.
Average read time can be pulled from Oracle Statspack and AWR reports at the tablespace and datafile level.
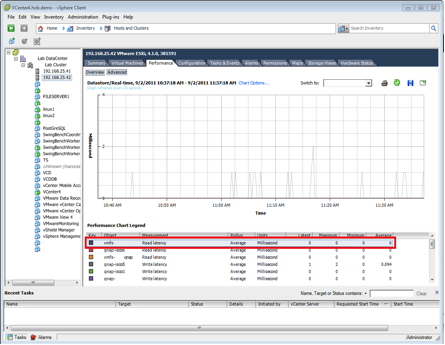
Read time can also be pulled from the vSphere Client:
Select a host or a VM in the navigation pane > Performance Tab > [Advanced] > select Data Store > select Real Time > click the Read Latency box.
Spindle Busy Average
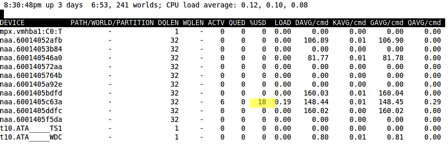
< 50% To run R/esxtop to display device, kernel, guest and queue latency start an r/esxtop session:
$ esxtop > v > [Enter]
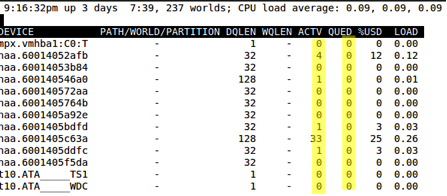
Look at the %USD column.
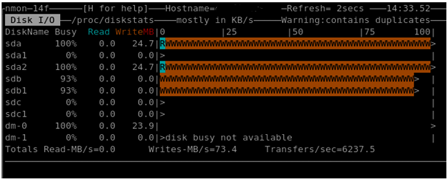
LUN percent busy
$ nmon > d
SCSI Queue Depth
<= teens (after having reconfigured all storage path devices to 128, up from default of 32)
The default SCSI queue depth for ESX is 32.
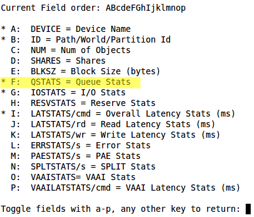
$ esxtop > d > f > [Enter]. Verify that QSTATS is selected with an asterisk to the left as pictured below.
Storage Latency
For day-to-day monitoring of disk throughput, latency is the ideal metric. It is more accurate in determining if your database is suffering from I/O throughput issues. The performance redlines for disk latency should be 20ms or lower. With latency it is acceptable to have burst periods of higher than 20ms latency, but not consistently.
R/esxtop monitors disk latency at three distinct layers, the device or HBA, the kernel or ESX hypervisor and the guest or virtual machine. Use the free IOmeter storage benchmarking tool in a Windows guest (only the Windows version can do asynchronous writes, not the Linux version). Configure the tool for the Oracle database default block size and a 32GB streaming write (large enough to pierce the write cache of many SANs).
To run R/esxtop to display device, kernel, guest and queue latency start an r/esxtop session:
$ esxtop v > f > h > i > j > enter
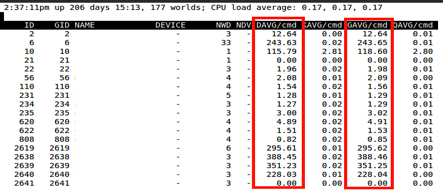
The GAVG or guest latency is actually a combination of the device latency + hypervisor + any additional guest OS overhead.
The KAVG is the kernel latency or hypervisor latency. High latency reported at the kernel can be due high SCSI queues or device drivers.
DAVG is the device latency or HBA latency. We use the term HBA generically, including an actual fiber channel HBA or iSCSI NIC. Device latency usually indicates a bottleneck at the storage or SAN layer.
By monitoring the four distinct layers we can clearly see the HBA is an issue with the SAN configuration. If just GAVG was high then we would have had looked at the Linux guest. This customer had very serve device latency (DAVG). This related back to a SAN issue that was later fixed by the storage vendor with a firmware upgrade.
Storage Throughput
Given a 4Gb Fibre Channel fabric, you should be looking at >100MB/sec/storage path sustained. If you are getting less than that, consider splitting out storage paths.
CPU Ready Time
The VMware definition of CPU Ready is, “the time a guest waits for CPU from the host while in a ready-to-run state” (VMware ESX Server 3: Ready Time Observations – http://www.vmware.com/pdf/esx3_ready_time.pdf) We also refer to CPU Ready Time as the ”guest heartbeat.”
We generally monitor CPU Ready Time through VI client. ESXTOP can also be used. However, we prefer the VI client because it measures CPU Ready in milliseconds.
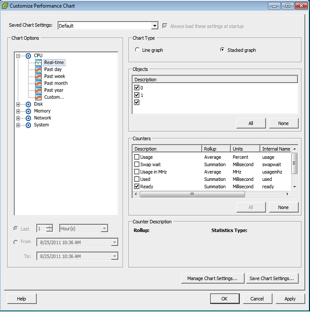
Select the virtual machine > Performance tab > click Advanced > click Chart Options… > CPU > Real Time > and select Ready
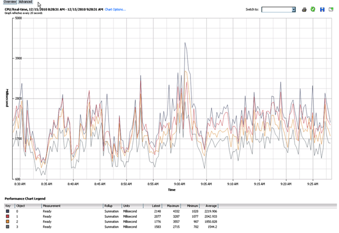

It is normal for a guest to average between 0 – 50ms of CPU ready time. Anything over 300ms and you will experience performance problems. We’re comfortable with up to 300ms CPU Ready Time on average, with a high water mark of 500ms.
ESX Memory Oversubscription
Do not oversubscribe memory shared by Tier-1 Oracle workloads. VCS should report no ballooning.
Oracle is very aggressive at using all of the resources available to it. When an Oracle instance starts up, it allocates memory for the Oracle SGA. This allows Oracle to use a contiguous space of memory for caching of data and SQL statements. As long as the instance is running, it will not give the memory back even if blocks are unused. Oracle memory is less dynamic then CPU. It tends to level out after the Oracle SGA has been allocated. You may see brief periods of spikes when the PGA is being used for a RMAN backup, but other than slight anomalies it tends to stay static. As with CPU, measure memory during peak workloads.
We recommend memory sizing by using the following 3 tools:
Oracle SGA Advisor.
Oracle PGA Advisor.
OS metric collection (for example, nmon)
Start with the Oracle advisors first to determine if the SGA and PGA are accurately sized. We consider the SGA critical to virtual machine sizing. If, for example, the Oracle SGA is undersized this will affect your buffer cache hit and shared pool, negatively impacting performance. It will also skew your OS metric collection. After the SGA and PGA are sized accurately then use the OS collected metrics to determine the appropriate memory size of the virtual machine.
Allocate enough ESX physical memory to at least cover the Oracle SGA, and preferably as large as the sum of the SGA, the PGA high water mark, and memory used by the shadow processes. If you use reservations, make sure that there is enough extra physical memory in the cluster that the failed over VM will not refuse to start.
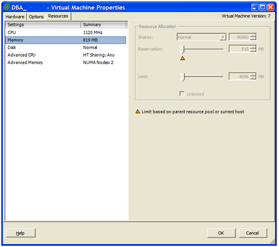
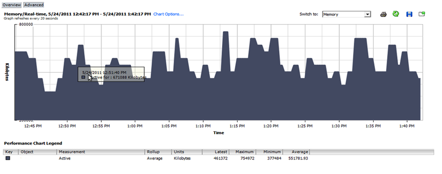
In vSphere Client, select the VM > Performance tab > Advance tab > Chart Options… > Memory > Real Time > Active
Network Performance
We confess that we rarely run into network configuration issues that impede VMware Infrastructure performance. Just the same, we’ll offer a standard. There is always the possibility that a workload changes its virtual machine memory blocks at a high rate. A workload so hot that it generates dirty memory blocks faster than the proprietary vMotion interconnect can move in thirty seconds is justification for beefing up the interconnect hardware capacity through faster NICs (or converged technology), teaming NICs, or both.
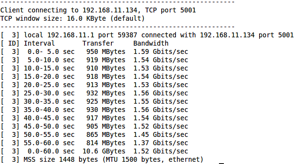
iperf Network Load Test
Conceptually the network load test should be used to force the max throughput of the network fabric and interfaces. Similar to the memory it flushes out any potential drive issues, hardware issues or network topology issues. This test is to validate performance and push the max throughput of the interfaces to determine if there are driver issues or stability problems.
Iperf is a network testing tool. It is able to create a TCP or UPD data stream between two nodes (or virtual machines). Iperf is open source software available for both Linux and Windows at http://sourceforge.net/projects/iperf/. Below is a simple test that runs for 500 seconds testing the maximum throughput of the network interfaces.
Server Node
$ iperf -s -i 5
Client Node
$ iperf -c -t 500 -i 5 –m
Dropped Packets
For network packets on a LAN, you ideally should not see dropped packets. Dropped packets typically indicate congestion in the network or failing hardware. One percent dropped packets in either direction can throttle throughput by as much as 15 percent.
In vSphere, dropped packets can be monitored by selecting the ESX host > Performance tab > Advanced > Network > Real Time > select None in Counters > then check Receive packets dropped and Transmit packets dropped