Jonas Mason, Senior Consultant
In prior blog posts I have covered 1) performing a general performance assessment of an Oracle instance, 2) troubleshooting Oracle performance, and 3) how a company’s culture that can contribute to poor Oracle performance.
In this series of blog posts, I will address how to leverage Oracle’s Diagnostic and Tuning Pack features to assess and remediate the performance of SQL statements. I will cover SQL Tuning Sets in this blog, followed by a review of the SQL Tuning Advisor and Access Advisor in upcoming blogs.
The goal of using these tools is to both reduce server resource utilization and improve SQL execution times. Expensive tuning and remediation time by DBAs and Developers is reduced when leveraging these tools. Given the potential reduction in CPU utilization that is possible once these tools have been implemented, this can be an efficient and effective way to maintain and potentially decrease your Oracle license costs.
Diagnostics and Tuning Pack recommendations should always be implemented with input from the DBA, Developer, and application owners as well as be subjected to peer review and change control. The statistics gathered in SQL Tuning Sets over a set period of time can help inform all parties of the extent of the improvement gained by tuning efforts.
Significant reductions in server resources, such as CPU and I/O utilization, should be demonstrated as a result of any SQL tuning endeavor. Diagnostic and Tuning Pack tools can provide empirical evidence of these improvements, when implemented correctly.
While it is possible to implement these features using the command line, this blog will focus on the implementation of Diagnostic and Tuning features using Cloud Control.
SQL Tuning Sets
SQL Tuning Sets are logical containers for SQL statements and the statistics associated with their execution in your environment, and can be created manually with just one or two SQL IDs. SQL Tuning Sets can also be populated during a custom time period with a scheduled job. It can be useful to schedule these jobs during periods of high activity, such as batch processing on a Sunday, from 2:00 am to 4:00 am, for example.
Another use for a SQL Tuning Set could be to capture a week or day of activity during a peak period in 2016, in order to compare to the same peak period in 2017 or 2018. This year-to-year comparison for an instance is very useful for identifying trends in the performance of statements and the server resources they consume. The baseline statistics contained in a SQL Tuning Set can also help troubleshoot future performance problems by answering questions such as:
- Did a SQL statement’s execution frequency change?
- Did new SQL statements get introduced to account for increased resource utilization?
- Did explain plan costs change significantly despite no change in a SQL statement?
SQL Tuning Sets are also valuable when upgrading Oracle to new versions, as an entire instance SQL workload can be evaluated in an upgraded non-prod instance with far less QA and Developer time. DBAs can proactively determine if performance will improve, stay the same, or degrade for SQL statements included in the Tuning Set. All SQL statements in a SQL Tuning Set can be evaluated in the upgraded Oracle instance with the SQL Tuning Advisor, just as they were in the prior version. Any SQL statement performance regression that is observed in a non-prod instance can then be remediated prior to go-live.
Create a SQL Tuning Set
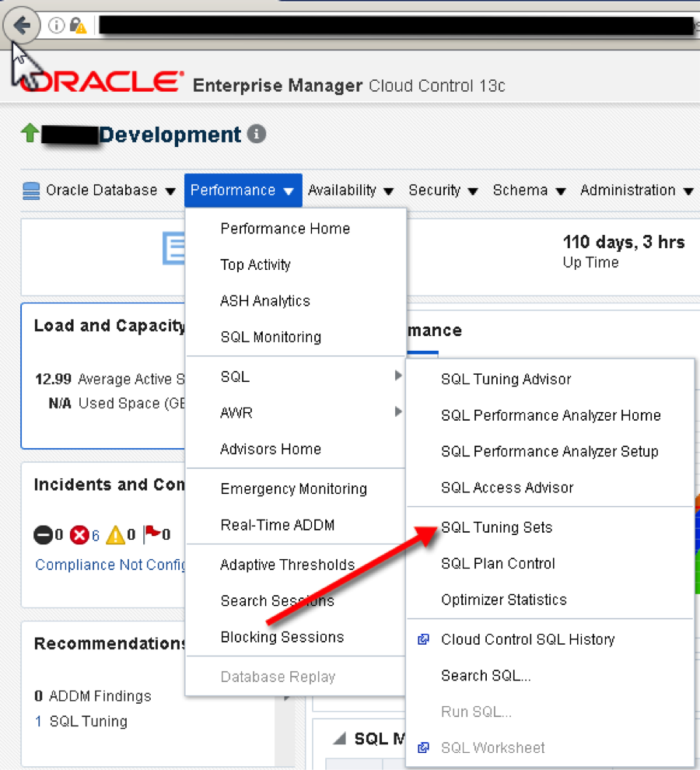
If viewing database instance performance real time, you can navigate to the SQL Tuning Set page in cloud control by selecting Performance -> SQL – > SQL Tuning Sets, see Figure 1 below:
Figure 1: Navigating to SQL Tuning Sets
You will see a screen that presents existing SQL Tuning Sets, if any. In drilling into the SQL Tuning Set TEST, we see SQL and execution statistics. Figure 2 shows existing SQL Tuning Sets; select ‘Create’ to create a new SQL Tuning Set.
Figure 2: Viewing Contents of Existing SQL Tuning Set
The SQL Tuning Set TEST contains statistics for SQL captured from this instance every five minutes over a one-hour period from September 7th, 2016 at 5:52 PM to September 7th, 2016 at 6:47 PM. This time period could have been modified to cover a week-long period of activity, or a shorter duration. A week of activity may be captured to both establish baseline performance and tune SQL. If your instance is having performance issues during a certain time of day for a report, batch process, or other end user response time complaint, a SQL Tuning Set can be created to capture all activity during this more narrowly defined time period. This is more effective than using a statspack or AWR report because all SQL activity is captured, and not just the top five or 10 SQL statements based on CPU, execution time or physical reads and writes. It is also possible to specify a capture filter on the data, so you don’t see all SQL activity for an instance.
Figure 3 shows a small subset of SQL statements in the TEST SQL Tuning Set, sorted by elapsed time in descending order:
Figure 3: TEST SQL Tuning Set SQL Statistics
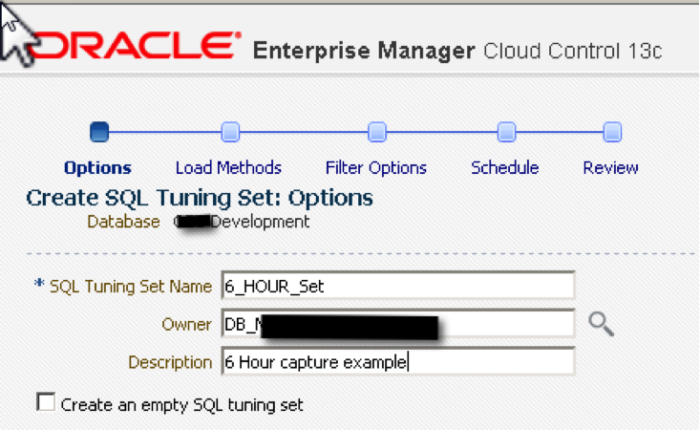
Figure 4: Create New SQL Tuning Set
Figure 4, above, illustrates where to enter the SQL Tuning Set Name, Owner and Description.
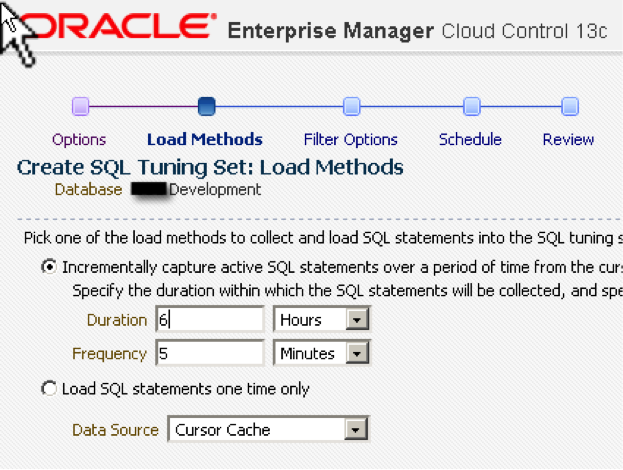
Figure 5: Schedule Capture Time for SQL Tuning Set to be Populated
In Figure 5, we are specifying that for a six-hour period, the SQL Tuning Set will be populated every five minutes with SQL statements executed within the instance.
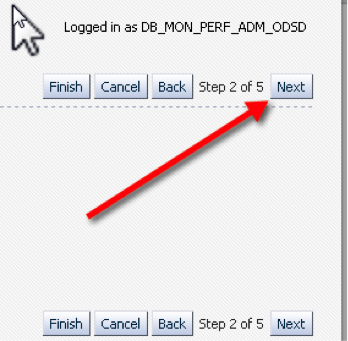
Figure 6: Hit Next
Figure 7: Select additional Filter Options
You can specify additional filter criteria for capturing SQL statements as shown in Figure 6, including high buffer gets, high execution counts, or significant disk reads. Do not enter any filters if you want to capture all SQL load for the instance during the specified time frame.
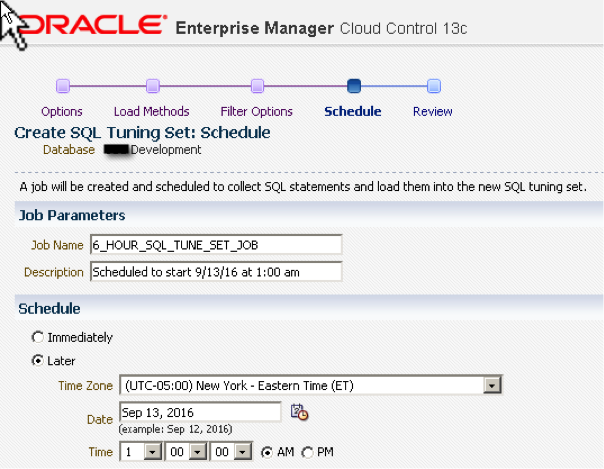
Figure 8: Set Job Name and Job Start Time (Immediate or Later)
In Figure 8, we specify that we want the Job “6_HOUR_SQL_TUNE_SET_JOB” to start populating the SQL Tuning Set “6_Hour_Set” at 1:00 am September 13, 2016.
Figure 9: Select Submit
Figure 10: Review SQL Tuning Set Options
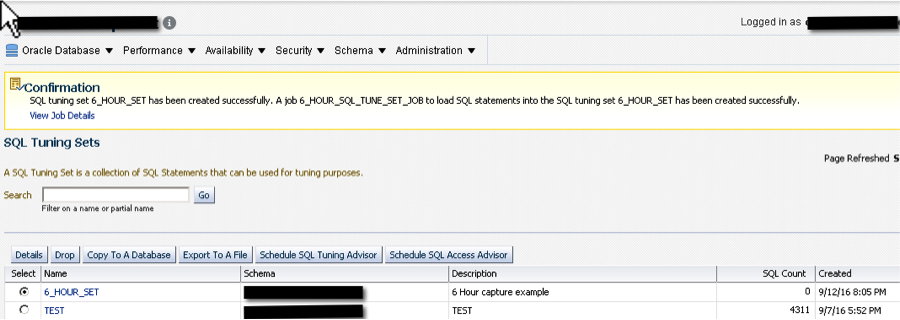
Figure 11: Review Confirmation of Job Creation
Conclusion
The use of Diagnostic and Tuning Pack features in Oracle begins with SQL Tuning Sets. You can immediately begin to schedule jobs to gather SQL statistics in SQL Tuning Sets to help you with performance problems now, as well as assist in troubleshooting performance problems in the future.
In my next blog, I will cover using the SQL Tuning Advisor and Access Advisor to make SQL Profile recommendations and DDL suggestions, such as indexes and materialized views. In some cases, the restructuring of SQL is recommended, or an explanation of why performance is poor is provided. Differences in SQL performance both before and after possible tuning recommendations are highlighted per SQL Tuning Set.
Diagnostic and Tuning Pack features such as SQL Tuning Sets, SQL Tuning Advisor, and Access Advisor are nice features, but certainly not required. When House of Brick recommends that a client consider these features, it is usually because of the following:
- CPU, Disk I/O and memory utilization is often very significant
- Data life cycle management practices do not exist
- Releases occur frequently and are not subject to much process
- Object permissions in production are loosely managed
- Performance of SQL and the Server is often outside of SLAs (if they even exist)
- The Business, DBAs, Developers, and Infrastructure are siloed and political
Diagnostic and Tuning Pack features in such an environment empower the DBA with tools to more effectively communicate with the business, their manager, and their peers about instance problems. Troubleshooting performance, upgrading Oracle versions, and acquiring right sized hardware is also easier with these tools. Significant SQL execution time reductions can also be realized with much less DBA and Developer time invested.
In next week’s blog, I will cover executing the SQL Tuning Advisor on a SQL Tuning Set to generate SQL Profile and index recommendations.


