


Reducing Risk and Cost in Your Cloud Migration Journey
I recently had a project where I needed to produce some reports as part of an overall data load process scheduled through a cron job on a Linux server. In over 20 years of developing applications and processes using Oracle technologies, SQL*Plus is not generally at the top of my list for generating nice-looking, well-formatted reports. Sometimes, however, this becomes the most convenient and cost-effective solution if you are not licensed for another reporting tool. In fact, a coworker reminded me of the option to generate HTML reports through SQL*Plus, which turned out to be a perfect solution for this project.
The purpose of this blog is to show how you can easily take a query executed through SQL*Plus and produce an HTML report that allows for custom formatting and can be viewed through a browser.
Step 1: Build a Basic Report in SQL*Plus
Let’s start with a basic report listing departments and employee information in the sample HR schema provided with the Oracle XE database.
set termout off
ttitle center "Employee Listing by Department" skip 2
btitle center "Confidential"
spool myreport1.txt
select dept.department_name,
       emp.last_name,
       emp.first_name,
       emp.salary
from hr.employees emp
join hr.departments dept on (dept.department_id = emp.department_id)
order by 1,2,3;

exit
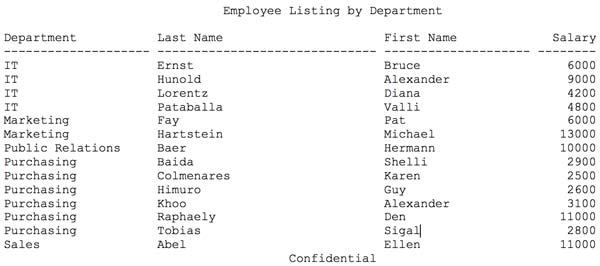
A sample of the output for the above report, run through SQL*Plus, would look like the following:
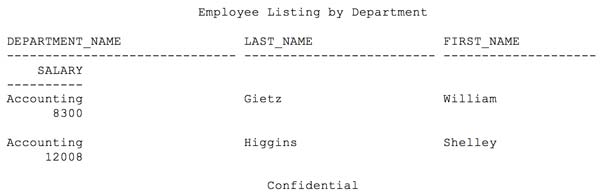
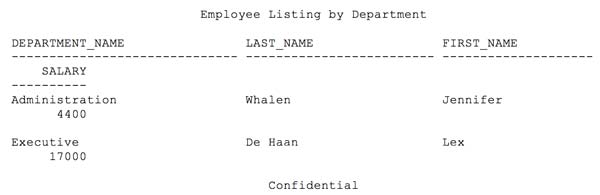
As you can see, the default formatting of the query output for SQL*Plus does not produce a report that would be acceptable for most situations, especially when more columns of data would be returned.
Step 2: Add Headings and Column Formats
However, we can easily do some formatting within SQL*Plus to make the output a little more presentable by setting headings, line and page sizes, and column formats. Here is the original query with some additional formatting added:
set termout off
set linesize 180
set pagesize 20
ttitle center 'Employee Listing by Department' skip 2
btitle center 'Confidential'
column department_name format a40 heading "Department"
column last_name format a40 heading "Last Name"
column first_name format a30 heading "First Name"
column salary format 9999999 heading "Salary"

spool myreport2.txt
select dept.department_name,
emp.last_name,
emp.first_name,
emp.salary
from hr.employees emp
join hr.departments dept on (dept.department_id = emp.department_id)
order by 1,2,3;
exit
A sample of the output for the above report, with this additional formatting, would look like the following:
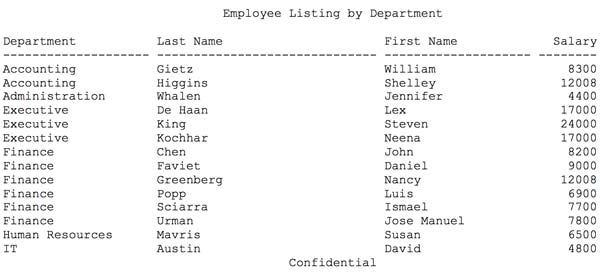
With this additional formatting, the report is starting to look better. Nevertheless, you still need to specify the lengths of all of the columns, as well as the line size to get the data to fit on one line or to be formatted in a way that’s easy to read. It is also still a text file, and if opened with Microsoft Word or WordPad without a monospaced font, the alignment will be off.
Step 3: Generate HTML with SET MARKUP HTML
Yet by specifying HTML markup within our SQL*Plus report, many of the sizing and alignment issues are handled by the browser instead. We also have the ability to draw attention to specific cells or values. Below is the previous SQL*Plus report with the HTML formatting added. As you can see, we have added additional HTML tags to draw out the “confidential” in the footer and to highlight salaries over $7500 in yellow.
set termout off
set linesize 90
set pagesize 20
ttitle center 'Employee Listing by Department' skip 2
btitle center '<span style="background-color:#c90421;color:#ffffff;border:1px solid black;">Confidential</span>'
column department_name format a20 heading "Department"
column last_name format a30 heading "Last Name"
column first_name format a20 heading "First Name"
column salary format 9999999 heading "Salary"

set markup html on spool on entmap off

spool myreport3.htm
select dept.department_name, emp.last_name, emp.first_name,

case when emp.salary > 7500 then
         '<span style="background-color:#eddd63;display:block;overflow:auto">' || to_char(emp.salary) || '</span>'
       else
         to_char(emp.salary)
       end as salary

from hr.employees emp
join hr.departments dept on (dept.department_id = emp.department_id)
order by 1,2,3;

exit
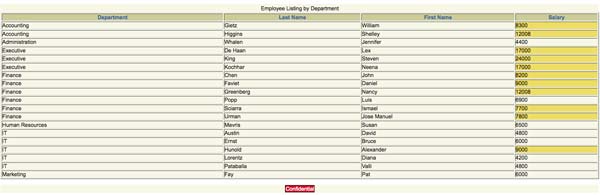
With just a few changes to the original SQL file (indicated in bold), we are able to generate an output file in HTML format and to add additional highlighting to column data and titles. The resulting file can be opened using a browser, a sample of which is shown below:
Key Settings: SET MARKUP, SPOOL, and ENTMAP
The key change to the report that allows for HTML formatting is the line:
set markup html on spool on entmap off
The “set markup html on” command is what produces the HTML formatting. By specifying “spool on”, it includes the “<HTML>” and “<BODY>” opening and closing tags at the start and end of each file created. However, this “spool” option on the “markup” command does not specify whether or not to write to a file. Therefore, you still need to include a separate “spool filename” command. Also remember to give your filename an “.htm” or “.html” extension.
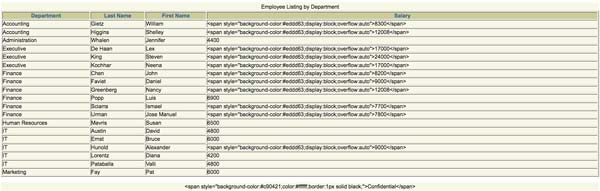
In order to get the additional HTML tags within the data to display correctly, the “entmap off” parameter is necessary. By default, the “entmap” parameter is set to on, causing certain characters, like “<” and “>”, to use their associated HTML entities (i.e. “<” and “>”). The “entmap” parameter can either be set globally as shown in the example above, or on an individual column basis. If the “entmap” parameter is set to on, the output will look like the following:
Customize the HTML Head, Body, and Table
There are additional options that can be used with the “markup” command, which will allow you set the contents of the HEAD section and attributes of the BODY and TABLE sections of the HTML report. For a complete listing of the different options, see Oracle’s documentation.
Customize the HTML Head, Body, and Table
This blog serves a reminder that there are options for generating nicely formatted reports through SQL*Plus. For the project I was working on, it allowed me to generate the report, highlight specific data within the report, distribute the output file through email, and allow the recipient to open the report in a browser.