


The trend of cloud adoption has revolutionized various paradigms of application hosting, lifecycle management, and operations, including monitoring tools and processes. Today, the native monitoring tools offered by cloud service providers are the first choice of most organizations, mainly due to ease of integration and robust out-of-the-box features.
For workloads hosted in Azure, Azure Monitor is a one-stop solution. It provides a comprehensive set of services that help cloud administrators keep track of and derive insights about performance, availability, and other telemetry information related to applications.
In this post, we’ll take a deep look at the monitoring capabilities offered by Azure.
What Is Azure Monitor?
Azure Monitor is Azure’s built-in monitoring solution. It unifies application performance, service monitoring, and platform monitoring. The Azure Monitor architecture is designed to consolidate metrics and logs from various resources in Azure and help analyze, visualize, derive insights, and respond to anomalies.
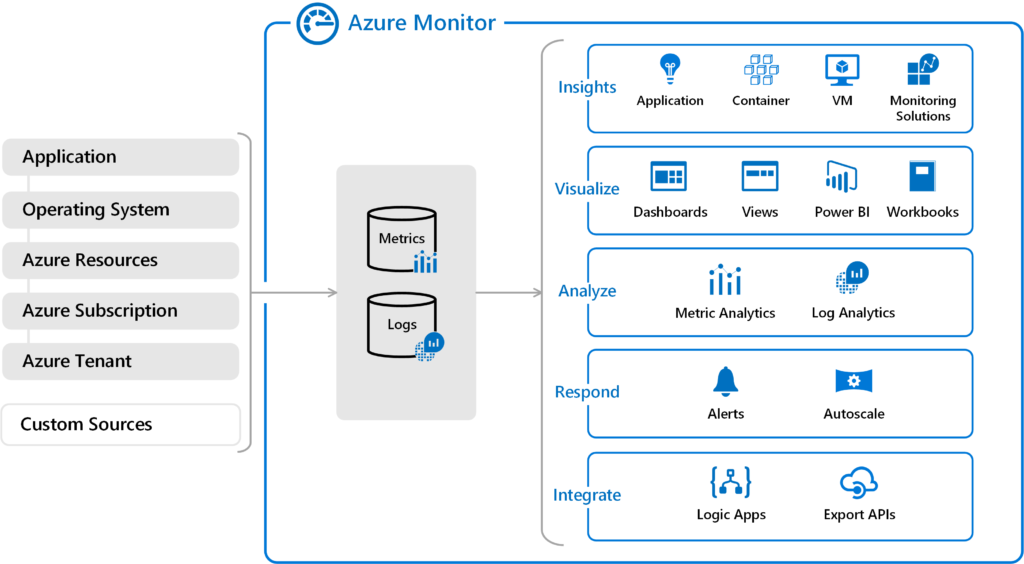 Figure 1: High-level overview of Azure Monitor’s architecture (Source: Microsoft)
Of course, the backbone of Azure Monitor is the monitoring data (namely metrics and logs) collected from various sources:
- Metrics: Numeric data collected from the monitored Azure resources. Metrics describe the system aspects at a specific point in time and are collected at regular intervals into a time-series database. The metrics explorer feature in the Azure portal provides visibility into the status of the system through charts plotted over time.
- Logs: Include more detailed data organized as records, encompassing events, traces, performance information, and more. Logs are used for querying and analysis through tools like Log Analytics.
Azure Monitor is capable of monitoring your applications and their dependencies, VM status, Kubernetes and container health, and more. As we just mentioned, Log Analytics is the built-in tool for log queries and interactive analysis of the outcomes, which can be visualized using dashboards. It helps correlate findings across your Azure landscape and drill down deeper for root-cause analysis.
When using Azure Monitor, you will be charged for data ingestion and data retention, according to the pricing model you choose. The Capacity Reservation model costs up to 25% less than the Pay-As-You-Go model for data ingestion of 500 GB/day. Pay-As-You-Go rates start with a free unit of 5 GB per billing account per month and $2.30 per GB for the remaining capacity of data ingested. Data retention in Log Analytics is free for the first 31 days and costs $0.10/GB/month after that. In addition to data ingestion and data retention, there are additional costs for using various Application Insights features, notifications, custom metrics, and so on.
Application Monitoring
When hosting applications in Azure, you can choose between IaaS and PaaS options. Azure Monitor can provide comprehensive monitoring for both of them.
IaaS Monitoring
When applications are hosted in VMs or VM scale sets, you can use Azure Monitor to collect monitoring data from the VM host, guest OS, and hosted workloads. For VM hosts, platform metrics that give insights into resource health and performance are collected automatically.
For the guest OS, you need an agent to collect and send the data to Azure Monitor. To collect different types of data, there are multiple agents available for Windows and Linux machines: Log Analytics agent, Dependency agent, Azure Diagnostic extension, and Telegraf agent, to name a few. The data collected includes information about performance, processes, and their dependencies.
Additionally, you can use the VM insights feature to monitor the performance and availability of applications deployed to Azure VMs, VM scale sets, hybrid machines connected to Azure Arc, and machines hosted on-premises or in other cloud environments. The collected data is stored in Azure Monitor Logs, which helps aggregate data over time and analyze trends. The VM insights feature is not enabled by default. To enable it, you need a Log Analytics workspace (either new or existing). Also, the Log Analytics agent and Dependency agent must be installed on the target machines being monitored.
The cost of VM monitoring includes data ingestion charges, health monitoring charges ($0.10 per monitored metric/month), alert rule charges (based on type and number of signals), and notification charges (based on the alert type being used).
Application Insights
Application Insights is the performance management service provided by Azure Monitor for applications. It can be used to monitor the live performance, dependencies, and usage patterns of your applications. It can also help detect anomalies in the application and use deep analytics features to correlate and investigate them. Application Insights can be directly enabled from Azure Portal for PaaS services like Azure App Service. You can also use Application Insights’ instrumentation package to integrate all of your applications (hosted on-premises or elsewhere), thereby gaining a unified view of your application estate performance statistics.
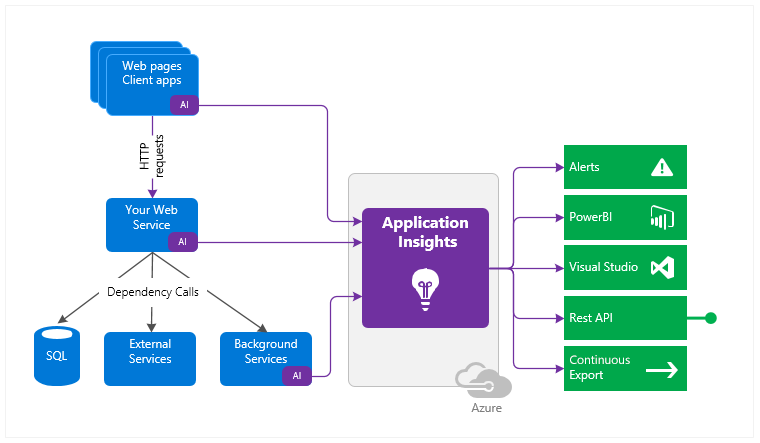
Figure 2: High-level overview of how applications are integrated with Application Insights (Source: Microsoft)
Application Insights monitors telemetry information like request rates, dependency rates, failure rates, user/session counts, exceptions, load performance, page views, and more. All of this will give you information about the performance and usage of your application. Additionally, Application Insights can monitor performance counters from operating systems, host diagnostics data, custom application events, and diagnostics trace logs from applications in order to deliver end-to-end visibility of the application stack. The telemetry data collected from various sources is integrated into Azure Monitor for unified visibility and diagnosis.
Container Monitoring
Azure’s Container insights feature helps you monitor container hosting platforms like AKS, ACS, AKS Engine, self-hosted Kubernetes clusters, Azure Red Hat OpenShift (preview), and Azure-Arc-enabled Kubernetes clusters (preview). It provides critical health and performance information about controllers, nodes, and containers by calling the Kubernetes Metrics API.
The container runtimes supported by Container insights include Docker and Moby, as well as CRI-compatible runtimes like CRI-O and containerd. In the backend, a containerized version of the Log Analytics agent is used to collect metrics and logs from Linux platforms. Container insights provides visibility into memory and processor utilization of containers, along with the host utilization statistics. It also helps correlate performance issues by monitoring cluster behavior under various loads.
Container insights is enabled through the Azure portal, through Azure PowerShell/CLI, or by using Terraform automation. In addition to performance metrics, the logs from containers are collected and made available in Azure Monitor through Log Analytics. You can create dashboards for visualization of the collected data to get additional insights and derive intelligence from the noise.
Lastly, it is worth mentioning that container monitoring is not as straightforward as other cloud components. There are multiple layers involved, and configuration drifts and non-standard configurations can slip in, especially when the container deployment is spread across multiple environments. This can lead to far-reaching consequences. In addition to native monitoring tools, you also need a comprehensive Cloud Security Posture Management (CSPM) solution to provide better visibility into such deployments.
Log Analytics
Log Analytics is used to query logs collected and consolidated by Azure Monitor. The queries should be written in Kusto query language (KQL). There are many pre-built queries available in Log Analytics that can help you get information on your application performance, such as response-time trends, operations performance, and failed requests. You can also create custom queries using KQL and save them. Azure Monitor allows you to create alert rules based on the log queries that get triggered when the defined thresholds are exceeded. The alerts can be configured for auto-remediation through Azure runbooks or Logic Apps.
You can use Log Analytics dashboards to visualize the outcome of saved log analytics queries and correlated data from different sources from a single pane. For example, log queries or custom queries related to performance can be pinned to the dashboard for trend analysis. The visualization can be done as a pie chart, column chart, area chart, scatter chart, or time chart. Dashboards can also be shared across multiple users so that they can be accessed by operations or application team members.
Azure Monitor workbooks are another option for analyzing data and creating visual reports. Workbooks can be written to query different kinds of monitoring data, such as logs, metrics, and Azure resource health. The data can then be transformed to provide visualizations about overall application and component health.
Conclusion
Azure Monitor provides a wide-ranging portfolio of services to monitor end-to-end application stack health and performance. Compared to third-party tools, native tools involve less dependency management and have organic integration. However, when it comes to environments deployed across multiple platforms, it’s difficult to get the same level of visibility and control with native monitoring tools.
OpsCompass
OpsCompass provides a centralized view for multi-cloud deployments, ensuring consistency and security across your cloud infrastructure, regardless of which provider is hosting it. House of Brick’s OpsCompass CSPM solution helps with cloud compliance and cost management of these heterogeneous deployments. It also monitors cloud environments for misconfigurations that could lead to security breaches and provides action recommendations to help you fix the problem.
Be it serverless computing, PaaS/SaaS/DBaaS, or containerized environments, OpsCompass can provide single-pane-of-glass visibility into the security posture of your multi cloud environment. For more info, check out our 30-day free trial, schedule a demo, or talk to an expert today.