Google Cloud’s operations suite (formerly Stackdriver) is a set of tools to help you monitor, debug, and trace your applications and infrastructure running in Google Cloud Platform (GCP). Stackdriver was created in 2012 to provide a SaaS solution to monitor cloud workloads. In 2014, the company was acquired by Google. Now, it’s profoundly integrated into GCP and has been expanded to be your eyes and ears when monitoring your cloud applications and infrastructure.
In this post, we’ll explore the suite’s critical use cases and tools.
Use Cases: Monitoring Infrastructure and Troubleshooting Applications
Let’s start by reviewing the two most prominent use cases of Google Cloud’s operations suite and how some of the tools in the suite are utilized in each case.
Monitoring the Infrastructure
Infrastructure in the cloud is distributed and physically far from you by nature. Therefore, it isn’t straightforward to track, collect data, or create an overview of the whole system. The suite’s logging and monitoring tools generate a summary of infrastructure and applications running in the cloud. Cloud Logging collects audit and platform logs, whereas Cloud Monitoring provides integration and visibility (as you’ll see in the image below).
Figure 1: Flow of monitoring the infrastructure (Source: Google Cloud documentation)
Troubleshooting Applications
Applications running in a single machine are easier to debug, trace, and optimize with tools that are already in every developer’s toolbox, such as the Java Debugger (JDB) or Delve for Go. However, when the database application runs in the Arizona data center and the backend application runs in the New York data center (for example), it’s challenging to trace, debug, and profile the applications. You can find the problematic parts of your stack using Cloud Monitoring and Cloud Logging, instrument the applications using Cloud Trace, and then run Cloud Profiler and Cloud Debugger (as illustrated in the following image).
Figure 2: Flow of troubleshooting applications (Source: Google Cloud documentation)
Google Cloud’s Operations Suite: The Tools
Now let’s review each tool in the suite in more detail.
Cloud Logging
First up, Cloud Logging, a scalable and managed service for collecting logs from various systems, including Google Cloud’s services, Google Kubernetes Engine (GKE), VMs, and even custom resources inside and outside the GCP. This tool helps you quickly resolve issues and provides real-time insights into your infrastructure and applications. In addition, it is fully managed by GCP, so it’s secure, scalable, and reliable.
Cloud Logging provides various cloud-native and innovative features, but the following three are the most important.
Logs Explorer
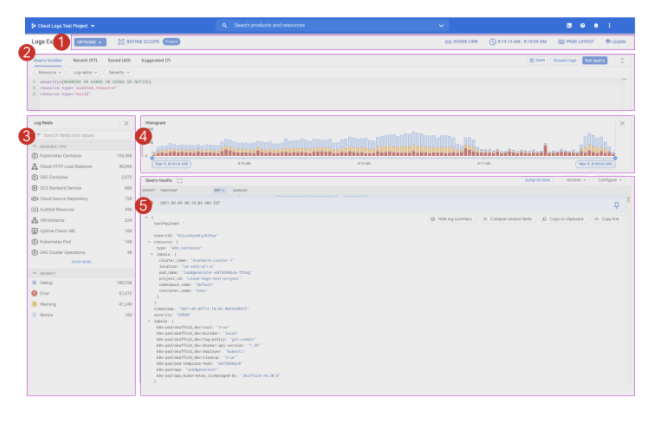
Logs Explorer is indispensable, as it allows you to search, sort, and analyze logs with its rich visualization capabilities. You can do all of this using the action bar (1), query builder (2), log fields (3), and histogram of events (4). You can then display full results (5), as shown in the following screenshot.
Figure 3: Log explorer with sections (Source: Google Cloud documentation)
Error Reporting
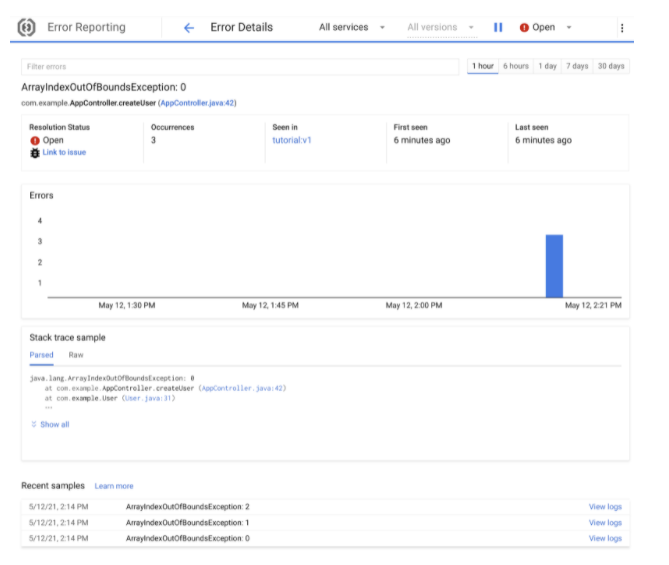
Errors are essential to finding edge cases, overlooked use cases, and boundaries of running applications. Therefore, you need to collect exceptions and errors from all your applications and intelligently aggregate them. Error Reporting helps you group and visualize errors with their sources, stack traces, and occurrences.
Figure 4: Error reporting in GCP (Source: Google Cloud documentation)
Cloud Audit Logs
As your teams get larger, and enterprise-grade requirements become the norm, you will need to collect audit logs and trails. Cloud Audit Logs creates transparency by collecting every administrative activity taken in your infrastructure. It allows you to store, analyze, and create alerts for the events that occurred in your audit logs based on your compliance requirements.
Cloud Monitoring
The second major tool in Google Cloud’s operations suite is Cloud Monitoring, which collects metrics, events, and metadata from various probes, including Google Cloud services, application instrumentation, and components. After this information is collected, you can visualize the data on charts, create dashboards, and generate alerts on the data. Cloud Monitoring helps create visibility into infrastructure and application statistics, including performance and uptime.
Although it sounds like a simple dashboard and alerting system, Cloud Monitoring is very intelligent. It makes it possible to monitor your applications, similar to how Google watches its own services. In order to achieve this Google-style monitoring, there are three essential features implemented in the Cloud Monitoring tool:
- Service Level Indicators (SLI): Measurement of performance in terms of collected metrics from your applications
- Service Level Objectives (SLO): The desired level of performance
- Error Budget: The measured difference between actual and desired performance
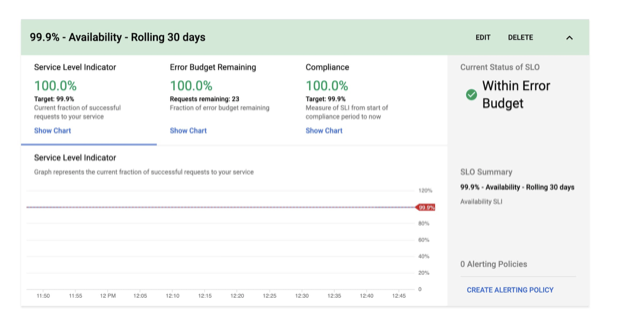
When you configure Cloud Monitoring, with three features above, for your applications, you can use the SLI and SLO-based dashboards, as follows:
Figure 5: SLO Monitoring (Source: Google Cloud blog)
Cloud Profiler, Cloud Trace, and Cloud Debugger
It’s rather straightforward to create cloud-native applications and deploy to the cloud with the tools and methods developed in recent years, such as containerization, Kubernetes, and service meshes. However, managing the performance of the distributed applications still feels like it’s part of the Dark Arts, since when you deploy a poorly designed application to the cloud, it may perform malicious activities, resulting in wasted time and high cloud bills.
Creating high-performance applications in the cloud is a continuous process of analysis and application enhancement. You can track the performance of your applications in terms of latency, cost, and efficiency with the help of Cloud Profiler, Cloud Trace, and Cloud Debugger (three more tools in Google Cloud’s operations suite). These tools are often used together as part of a three-step process to enhance performance.
Cloud Profiler
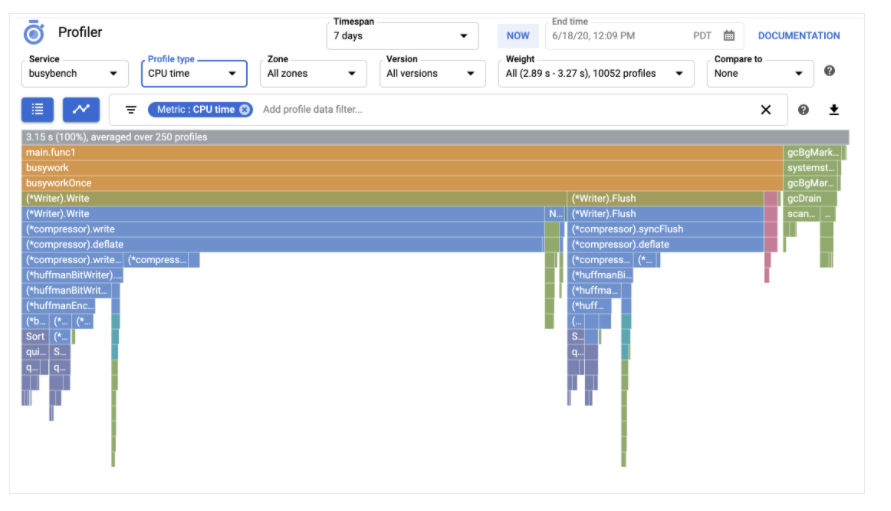
Cloud Profiler is the most commonly used first step in managing the performance of your application. It allows you to collect sampling data over the instrumentation of the running application’s instances. Using a flame graph (see Figure 6, below), it also helps you discover where your time and computation resources are being spent.
Figure 6: Cloud Profiler interface (Source: Google Cloud documentation)
Cloud Trace
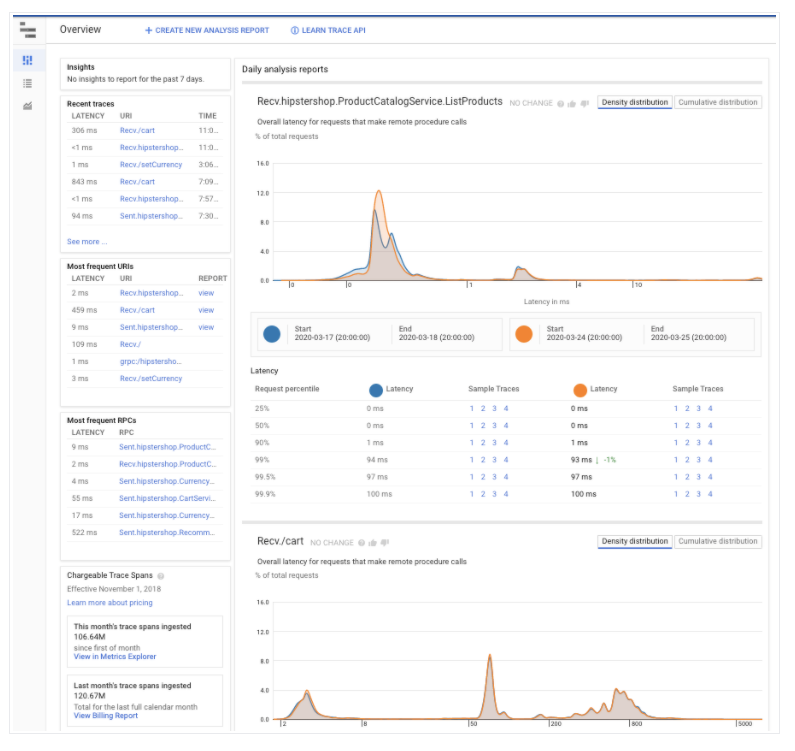
The second step in managing application performance is using Cloud Trace to follow how requests propagate through applications running in the cloud. Cloud Trace creates a trace to generate latency reports in order to find critical paths and performance degradations (as shown in Figure 7, below).
Figure 7: Cloud Trace overview (Source: Google Cloud documentation)
Cloud Debugger
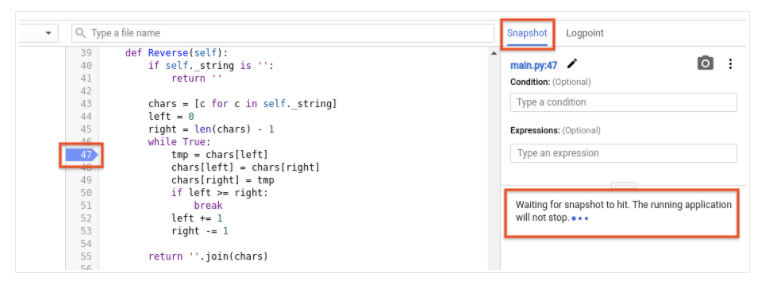
The third step in successfully managing application performance is Cloud Debugger, which is used to inspect your running applications in the cloud in real time. With Cloud Debugger, you can set breakpoints, as well as see the call stack and variables, without deteriorating the instances’ performance in the cloud. It’s a potent tool, as it provides a “look” into the code running in production (as shown in Figure 8, below).
Figure 8: Cloud Debugger (Source:Google Cloud documentation)
House of Brick + OpsCompass
House of Brick couples world-class software innovation with industry-leading consulting expertise to solve customers’ most complex cloud migration and operational challenges. If you are looking for complete cloud visibility, intelligence, and control of your cloud infrastructure and applications, OpsCompass is a great option. OpsCompass works with GCP, Azure, and AWS. As part of its holistic cloud visibility approach, it includes the following features:
- Constant compliance monitoring: Constantly evaluate cloud infrastructure security against multiple security frameworks.
- Multi-cloud visibility: Gain global visibility into your multi-cloud infrastructure
- Anticipate and control costs: Proactively manage cloud costs and take control in real time
- Detect configuration changes: Monitor and detect changes in cloud infrastructure and applications
To secure your cloud today, get started with OpsCompass for free. You can also schedule a demo for more information.

