


House of Brick Principal Architect
Welcome to part two in our series of posts regarding the virtualization of your business critical SQL Servers. This installment continues our discussion, detailing how to understand the actual workload of the physical server. To properly virtualize a server, the performance of the physical server must be understood so that you know how to objectively demonstrate the raw performance of the virtualized equivalent. This means that a proper performance benchmarking methodology should be created, and system baselines be maintained. These benchmarks are then repeated periodically and turned into baselines. When virtualizing your business critical SQL Servers, the virtualized proof-of-concept (POC) server is benchmarked and compared against the baselines of the physical server to objectively demonstrate equivalent performance.
I have yet to encounter resistance to the ‘lack of performance’ virtualization argument when I can produce objective results that show that the servers perform equivalently. Here is how to do it!
Benchmarks
First, if I were to ask you for an average run time for nightly SQL Server backups today, and a projection of how long they will take six months from now, could you provide it?
I didn’t think so.
Very few organizations that I encounter can produce a proper system baseline. Regardless of the infrastructure underneath it, every one of your systems should be performance baselined so you have a solid understanding of how it performs today. Baselines can then be maintained to help generate projections for growth of CPU, memory and disk consumption, transactional volume, and anything else measureable in your environment.
Perfmon-Metrics
The easiest way to start collecting performance data is to use Perfmon, which is built into any modern Windows platform. I set it to collect data every five minutes, store to a day-stamped file, and then rotate the file every night at midnight. This gives me a solid reference for how the system performs every day so that I can start to understand performance characteristics. For example, what sort of disk and CPU hit does my system take every night when system backups or an antivirus scan runs? Is a normal Monday’s workload different from a Friday?
We use specific Perfmon counters to understand these performance characteristics. This list includes the following operating system counters:
- Processor
o % Processor Time
o % Privileged Time
- System
o Processor Queue Length
- Memory
o Available Mbytes
o Pages/sec
- Paging File
o % Usage
- Physical Disk
o Avg. Disk sec/Read
o Avg. Disk sec/Write
o Disk Reads/sec
o Disk Writes/sec
- Process (sqlservr.exe)
o % Processor Time
o % Privileged Time
This list of Perfmon counters also includes the following list of SQL Server counters:
- SQL Server:Access Methods
o Forwarded Records/sec
o Full Scans/sec
o Index Searches/sec
- SQL Server:Buffer Manager
o Buffer cache hit ratio
o Free List Stalls/sec
o Free Pages
o Lazy Writes/sec
o Page Life Expectancy
o Page Reads/sec
o Page Writes/sec
- SQL Server:General Statistics
o User Connections
- SQL Server:Locks
o Lock Waits/sec
o Number of Deadlocks/sec
- SQL Server:Memory Manager
o Total Server Memory (KB)
o Target Server Memory (KB)
- SQL Server:SQL Statistics
o Batch Requests/sec
o SQL Compilations/sec
o SQL Re-Compilations/sec
- SQL Server:Latches
o Latch Waits/sec
All of the SQL Server counters can be collected from within SQL Server via system DMVs, but the Windows counters cannot.
Details on how to take the Perfmon output file and convert it to a readable format are located here:
http://blogs.technet.com/b/askperf/archive/2008/05/20/two-minute-drill-relog-exe.aspx
Once you get these items into a readable (or importable) format, the sky is the limit on what you can do with this data. You can build a macro that compares and contrasts data in MS Excel. You could import them into a database. Build whatever system works best for you and your environment.
Disk Performance
Raw disk performance is paramount to solid SQL Server performance. To better quantify the performance, no better (free) tool exists than SQLIO. It is free to use and is available from Microsoft at the following URL: http://www.microsoft.com/en-us/download/details.aspx?id=20163
I use this tool almost daily to benchmark client disk subsystems. It allows an administrator to select a drive and workload size and then drive varying types of I/O tests in varying degrees of intensity. I have created a test script and a workload analyzer that assists with a quick setup, test run, and then a full analysis. It is available at http://tools.davidklee.net.
SQL Server and Windows Metrics
My first resource for investigating a server that I am unfamiliar with is Glenn Berry’s SQL Server Diagnostic Queries at http://sqlserverperformance.wordpress.com. He maintains a version of his queries for each version of SQL Server. Download and execute the query set for the version of SQL Server you are running, and look at the output of each query. If you find a set of results that you are interested in, store the output and include it in some data container for future reference.
In addition to these queries, any number of other SQL Server and Windows metrics should be collected. Some of the items that I routinely collect are:
- Windows disk capacity versus used numbers.
- SQL Server maintenance timings (full/diff/log backups, index and statistic maintenance, dbcc checkdb, any custom nightly jobs, etc.).
Anything measurable that is important to your environment could (and probably should) be repeatedly measured for your benchmarks.
Query Performance
One of the best measures of your server performance is through executing queries against a sample workload that are timed and baselined in the production environment. Through workload generation you could you reproduce a workload similar to production in your testing environment. You can then execute queries against the test VM to compare runtimes and things like CPU and memory impact.
Here’s a little hint – did you know you can add a flag before a query runs to get the logical I/Os and exact runtime of a query? This little trick works great for benchmarks.
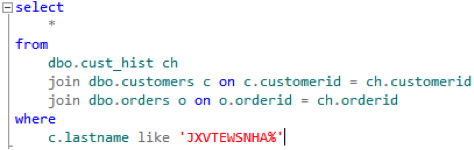
Normally, if you run a query such as this (using the DVDStore DS2 database as a sample workload):
Then you get the following output:
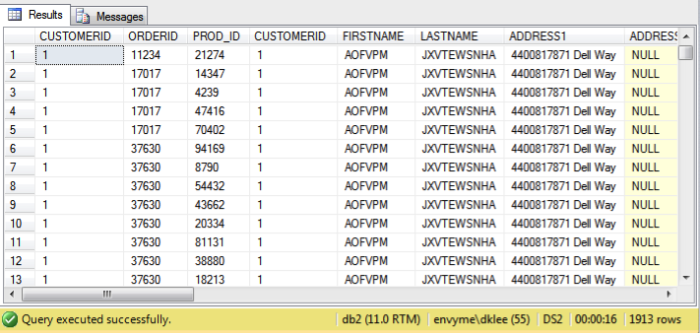
You can see that it runs in 16 seconds.
What about this output with the same result set?
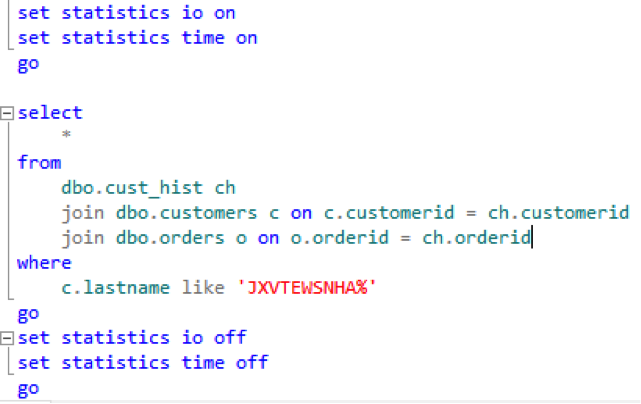
You get the following statistics:
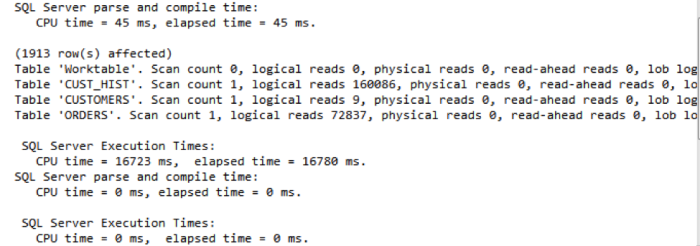
This is much better. You can now see the local reads and the exact execution time. You also know that tempdb was used to assist this query from the creation of a ‘Worktable’.
Benchmarking Guidelines
The bottom line with benchmarks is to create a repeatable, consistent methodology for benchmarking your environment. It must be repeatable in order to quickly reproduce it in the event of an emergency. This allows you to determine if a performance problem exists in your system stack. It should be documented and clear to follow.
What if a system configuration change alters the performance of a system component, and it is reported a month after the change happens? How easy is it to pinpoint that change as the culprit? This is why that we recommend benchmarking your system after every major system change. A major system change can include any of the following examples:
- OS / application version upgrades
- Service pack application
- Hardware updates
- BIOS / firmware upgrades
- Networking changes
- Additional workloads placed on shared devices (such as storage, VMware hosts, etc.)
Performing quick benchmarks after these changes can identify performance issues very quickly, and you know exactly what changed at that point. It amazes me how small things can dramatically alter a system’s performance levels, and how hard it usually is to identify after the fact.
Baselines
Now, what good is a benchmark if you do not have a running average metric to compare it against?
A baseline is a rolling average of your repeatable benchmarks. You should routinely (and not just once a year either) benchmark your systems and compare against a rolling baseline to see how things are performing. Once completed, update your benchmarks accordingly with the updated data.
You could even develop a system that collects periodic benchmarks and maintains a rolling baseline automatically. It’s a fairly trivial task to construct one of these systems, but they will take time to construct. There are many products out that you could purchase that capture some of these metrics. Again, the sky is the limit with what you can construct and build here.
The bottom line with benchmarks is that not only do you have an objective measure of the average performance of your systems, but, in the event of a problem, you have an objective means of defending your system. It can even help point out performance problems in other systems. If a performance problem does show up in your system, you have the ability to quickly determine the area that requires more focus, and the means to prove when it is resolved.