


Jim Hannan (@HoBHannan), Principal Architect
In part 1 of this blog we covered real time, baseline, and health check tools for troubleshooting middleware performance issues. In this part, we will take a look specifically at troubleshooting Java on middleware. Effectively tuning Java requires knowledge of the operating system and how it works. Often I find OS performance tools are a good starting point for determining what is causing an issue and which resources are impacted. That being said, the issue may not always become clear by using the OS performance tools discussed in part 1 of this blog, which I think can be especially true with Java. So, in this second part we will look at common Java issues, how to fix them, and what tools to use for troubleshooting issues.
The most common Java performance issues are with garbage collection (GC). What does the Java garbage collector do? Simply put, the garbage collector’s job is to reclaim unused memory. It does this by identifying which objects are in use, and which objects are not – it then removes the unused objects. However, reclaiming memory comes at a cost to the application. The default GC policy causes, during a collection, what Java calls a “Stop the World” event. This event will cause a pause in the application while unused memory objects are being reclaimed. You can monitor GC events by using tools such as jstat or JConsole, which both come with the JDK kit.
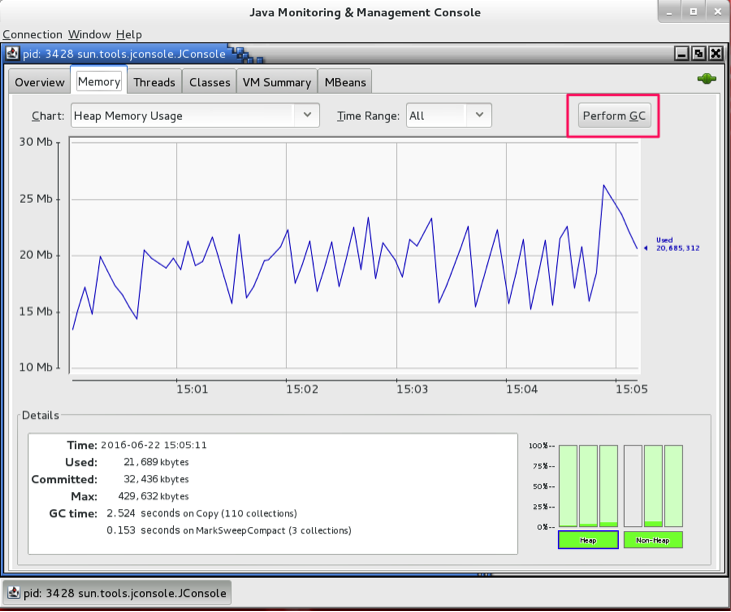
JConsole can be started by simply clicking the icon in your program folder, or running jconsole from the command line in Linux. You will need a GUI desktop or a XWindows redirect in order to run the GUI. It can connect remotely to java processes, which is very handy for troubleshooting a remote server. In Figure 1 below you can see Jconsole running, with the memory tab selected, to observe garbage collections. Also note in the highlighted section, that you can perform garbage collection right from the interface.
Figure 1 – Jconsole
Next we will look at jstat, which is a command line tool that is very handy when you don’t have a GUI desktop. As I mentioned before, jstat is part of the standard JDK bundle released by Oracle. It is a performance-monitoring tool that tracks GC activity (among many other things). The tool can be run using the following command:
Figure 2 – JDK tool command
![]()
VMID is the Java process in question, and can be easily identified by using top (Linux command) or NMON. Both tools will show the top CPU process as a Java process. Once the PID of the Java process is identified through top or NMON, plug it in to the jstat command as the VMID parameter.
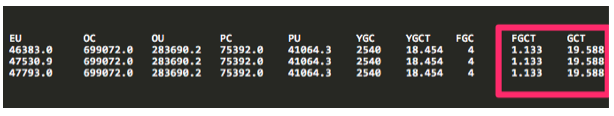
In the output you will see the key GC metrics FGCT and GCT. When GC is running, these metric values will increase (incrementally).
![]()
Figure 3 – GC statistics from jstat
Garbage Collection Memory Tuning and Garbage Collection Policies
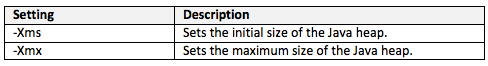
What can we do to fix GC events from causing frequent pauses in the application? Much like the Oracle database, Java can be tuned. Generally the amount of memory given to the Java Heap, and the GC collection policy are two areas to review and tune.
Typically a good place to start is with memory allocation, the idea being let the workload have more memory to reduce the frequency of GC events occurring.
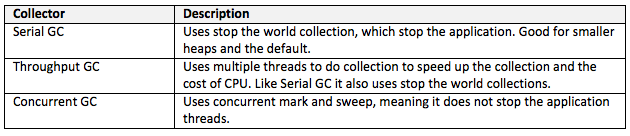
The Garbage Collection has three collection policies. They are Serial Collector, Parallel/Throughput Collector, and Concurrent Mark and Sweep. A description of each can be found below.
Conclusion
As I discussed in part 1, application performance may not always be the result of a database problem. Additional tuning can also improve database performance, specifically tuning Java on middleware. As discussed in this blog, monitoring garbage collection, a common source of Java performance issues, using tools like jstat or JConsole can help in troubleshooting and tuning Java performance issues.