


Jim Hannan (@HoBHannan), Principal Architect
This is a revision of a previous blog post I did a few years ago on CPU Ready Time. This time I will break it into two parts, the first covering an overview of CPU Ready Time, how to monitor for it and the enhancements to the co-scheduler. The second post is a collection of tables to help you quickly calculate CPU Ready Time. I find the tables helpful for analyzing CPU Ready Time across the different capture periods, which are Real Time, Day, Week, Month and Year.
What Is CPU Ready Time in VMware
CPU Ready Time is a vSphere metric that records the amount of time a virtual machine is ready to use CPU but was unable to schedule time because all CPU resources (on a ESX host) are busy.
Virtual Machines and Enhanced Co-scheduler
The hypervisor (virtualization kernel) has become very efficient at optimizing scheduling. In fact the scheduler has undergone significant modification with each major release of ESX. In the next section we will discuss the current co-scheduler and its enhancements.
At this point it is very well known that the maximum vCPUs a single VM can run is 64 vCPUs. For me, this number is staggeringly high. At HoB, we have been virtualizing VBCA workloads as far back as ESX versions 3 and 4, with a maximum of 4 and 8 vCPUs respectively. In our estimation, 90% of the workloads can fit into a configuration of 8 vCPUs (or fewer). At Indiana University,we experienced this first-hand when assisting them with virtualizing their OnCourse system. The OnCourse Oracle database was previously on an AIX Power5 LPAR with 12 CPUs allocated. During peak workloads, the Oracle database was consuming 9.5 processors. After virtualizing the workload and completing load testing, we determined not only that the workload would fit without the 8 vCPU max, but it was only using between 35% – 50% of the CPU. This left a lot of scalability for the database. Fast forward to today. With a maximum of 64 vCPUs, the door has opened for virtualizing 95% of the workloads in existence.
From 8 vCPU to 64 vCPU: How VMware Did It
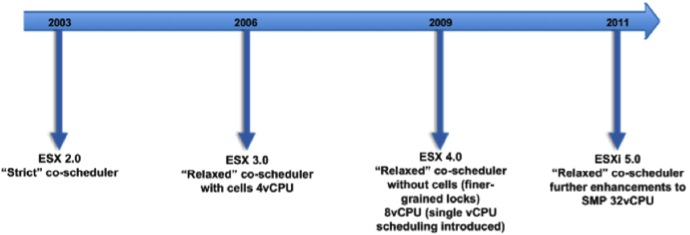
This is an intriguing question. The best-updated public information available on this achievement is discussed in the VMware whitepaper – The CPU Scheduler in VMware vSphere 5.1. The “relaxed” co-scheduler was first introduced in ESX version 3.0 with a maximum single VM vCPU configuration of 4. In this version, the VMware engineers adapted a cell model. The cells were assigned to pCPU (physical CPU). A common processor configuration during the ESX 3 release was a physical processor with 4 cores. As pCPU core counts increased with AMD and Intel chips, VMware determined that the cell model was no longer adequate
In ESX 4 the VMware engineers moved from the 4 vCPU limit to 8 vCPU by eliminating the cell architecture to finer-grained locks. This allowed a single VM to span multiple pCPU and allows for scheduling of one vCPU for certain task. This gives the guest OS the ability to schedule one vCPU for single process or thread and greatly reduces the overhead or cost of CPU scheduling from the previous ESX version. ESXi 5 further enhanced SMP scheduling, increasing SMT application performance. This increase in some cases can reach up to 10% – 30% (see What’s New in Performance in VMware vSphere 5.0). And, of course, the new 64 vCPU maximum per a single VM increased from the previous maximum of 8 vCPUs.
Here’s the evolution timeline of the co-scheduler:
Monitoring CPU Ready Time in vCenter and esxtop
Monitor CPU utilization through vSphere Client or the esxtop command. vSphere Client is preferable because it measures CPU Ready Time in milliseconds. Select the virtual machine and click the Performance tab. Select Advanced > Chart Options > CPU > Real Time > Ready.
Figure 1 – Select CPU Ready from the CPU Chart Options
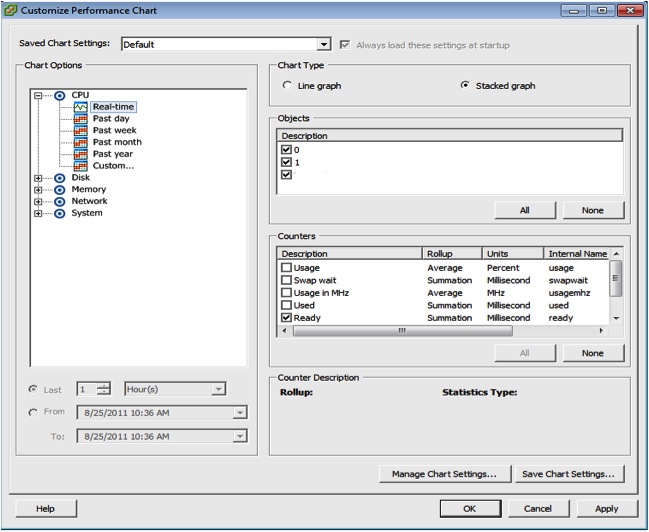
Figure 2. CPU Ready Time
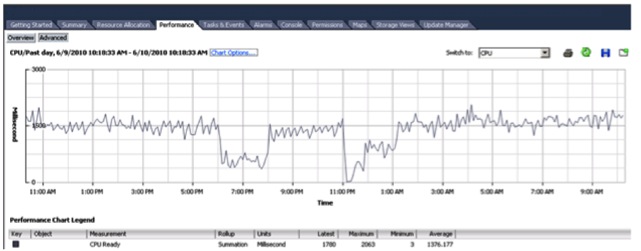
Figure 3. Monitoring CPU Ready Time
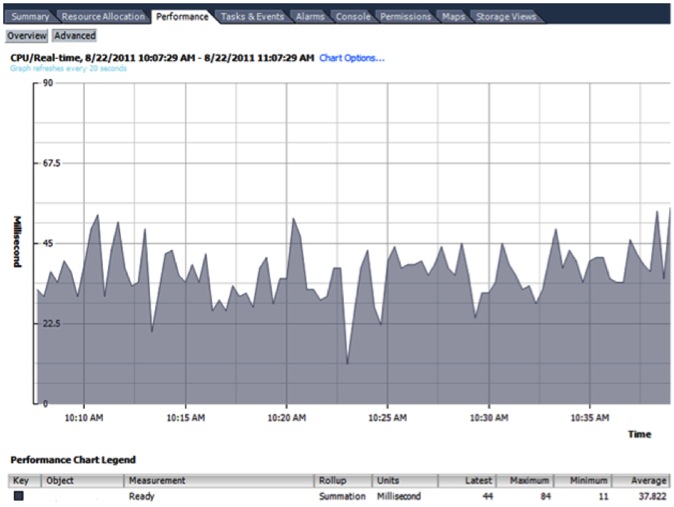
It is normal for a guest to average between 0–50ms of CPU ready time, which is called the “guest heartbeat.” Anything over 300ms can lead to performance problems. On average, up to 300ms CPU Ready Time is acceptable, with a high water mark of 500ms.
Learn all about CPU Ready Time – Blog Part II – coming next week.
Struggling With VMware Performance?
High CPU Ready Time often points to deeper infrastructure sizing or licensing issues, especially after the Broadcom acquisition changed VMware licensing. Our VMware Cost Optimization Assessment identifies both performance bottlenecks and licensing waste. If you need targeted help, our Performance Tuning Services deliver measurable improvements. Schedule a consultation.