

Jim Hannan (@HoBHannan), Principal Architect
In part 1 I covered SLOB (Silly Little Oracle Benchmark (SLOB version 1.x), in part 2, I will focus on the the setup and configuration of DB Time Monitor.
While I rely some on the AWR reports for determining the right amount of sessions, I find dbtimemonitor even more helpful for the initial tuning. DB Time Monitor or dbtimemonitor is another awesome tool created by Dominic Giles the creator of Swingbench. It can be downloaded here: http://www.dominicgiles.com/downloads.html by clicking on the DB Time Viewer link. After downloading and un-tarring the file you will need to edit the databases.xml for connectivity to your database.
Note: DB Time Monitor requires JVM 1.6+.
You will need to edit ConnectString, Username, and Password in the file. (See the screenshot below.)
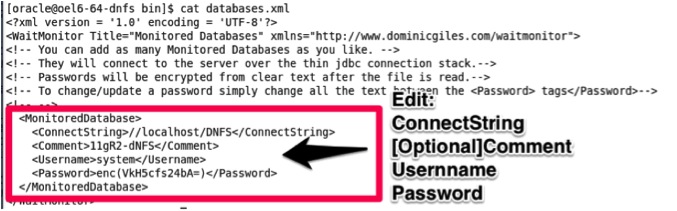
Note: The clear text password enter will be obfuscated after the first run.
After setting up the databases.xml file we can start the tool by running:
$ ./dbtimemonitor |
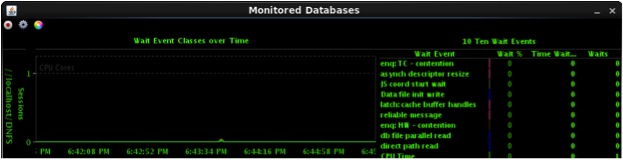
This will open the java tool window shown below:
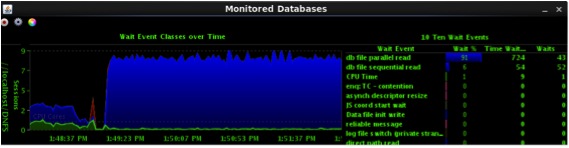
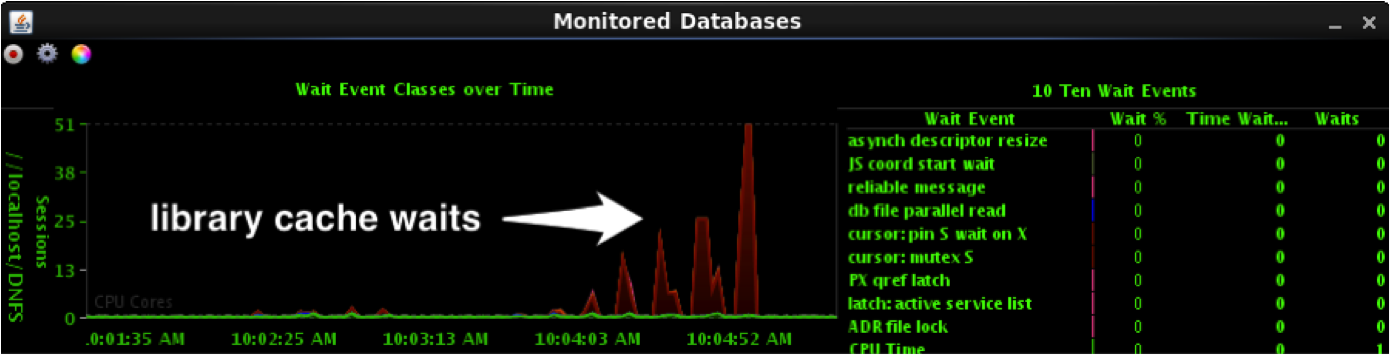
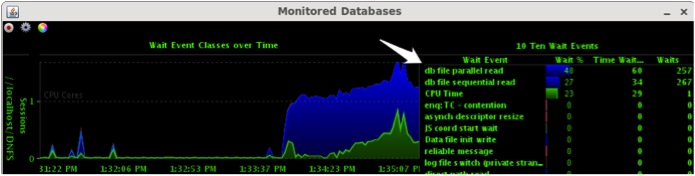
Now we will start another for loop and monitor for activity. I should tell you I had some issues with my SLOB setup, I did not notice when reloading the user data with setup.sh that it had failed (I forgot to specify the tablespace IOPS). By looking at the wait events with dbtimemonitor it was clear that things were not running as they should. Notice Library Cache waits (specify library cache lock); our wait events should be or related to db_file_parallel_read and db_file_sequentail_read. In this case it was not. By using dbtimemonitor it was useful to quickly determine the PIO benchmark was running incorrectly.
To fix the issues I decided to tidy everything up before screen capturing for this blog. I dropped the IOPS tablespace and recreated it. After that I ran setup.sh IOPS 128 again. Again I kicked off the for loop and immediately noticed the difference (see below).
There you have it. That covers both SLOB and dbtimemonitor. I may cover some more advance configurations of SLOB in a feature post, but if you are anxious to get more advance information I highly recommend Kevin Closson’s site mentioned above. In addition to all the great information Kevin has, his comment section is full of tips and advice from DBAs experimenting with different settings. I really enjoy SLOB, I do a lot of benchmarking in my job and it’s fun to be able to do it through the Oracle kernel. I expect I will be doing a lot more with both my home lab and future benchmarking for customers. If you have questions or comments I can be reached at @HoBHannan.
Finally I leave you with this, my virtual machine hit it’s maximum throughput at 4 sessions. I could see that in the AWR report Load Profile section. Here’s a screenshot of what dbtimemonitor looked like after 1, 2, 4 and in the middle of 8 sessions.