


House of Brick Principal Architect
A while back I wrote a post entitled ‘Why Your DBAs Need VMware vCenterAccess’. The response from the SQL Server community has been terrific! But,the response from the VMware administrators is always this: “How do I grant them the needed access?” It’s a two-fold problem. Let’s address it!We have two layers here. First, we’ll tackle the VMware VMs themselves. This is the most important piece of the real-time performance triage puzzle. The second layer is the host-level statistics, along with long-term performance archiving.
VMware vCenter Access
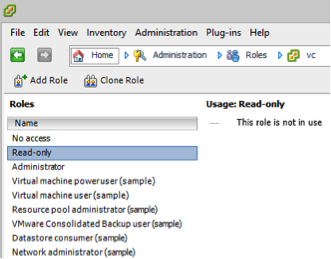
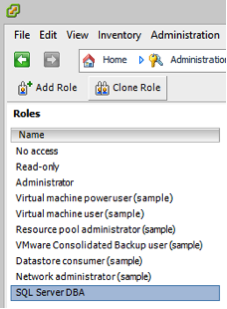
Your VMware administrator will need to grant you (at least) the following read-only permissions.Create a new role for the DBAs by cloning the Read-Only role. Name it something that stands out. We will keep this new role separated from other roles so that if it requires individual adjustment later on, the security changes are isolated to just this group. In this example, we’ll name it ‘SQL ServerDBAs’.
Now, if your VMware administrators are willing to allow you access to reboot a virtual machine, the ‘Read-only’ role should be changed to ‘Virtual machine user’. This role will allow some basic operations on the virtual machine, such as reboot or reset. At a very minimum, the read-only access is required to get to the performance statistics.
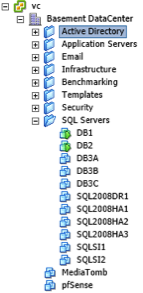
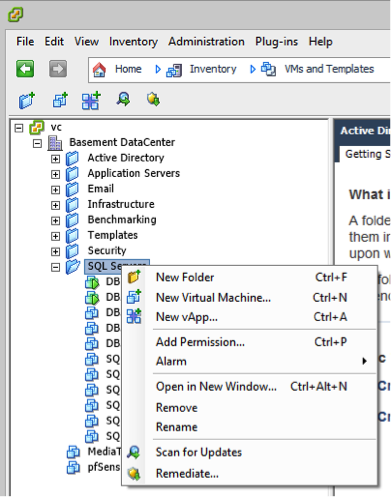
Folders can be used to quickly organize your virtual machines in a cluster. It is pretty easy to set up permissions to a folder rather than having to grant individual access to a large number of virtual machines. Set the permissions to the Active Directory group that your DBAs are members of to the folder that contains your SQL Servers.
Right click on the folder and select ‘Add Permission’.
Add the AD group and assign it to the newly created role.

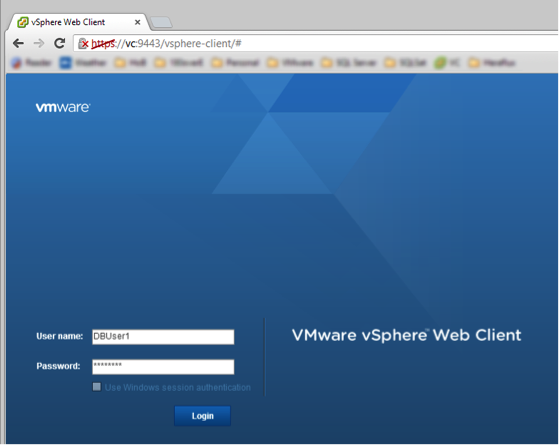
Have your DBA verify the access works by installing the fat client or surfing to the vCenter web access portal.
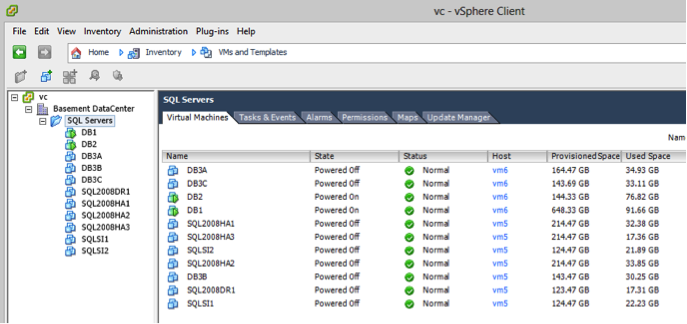
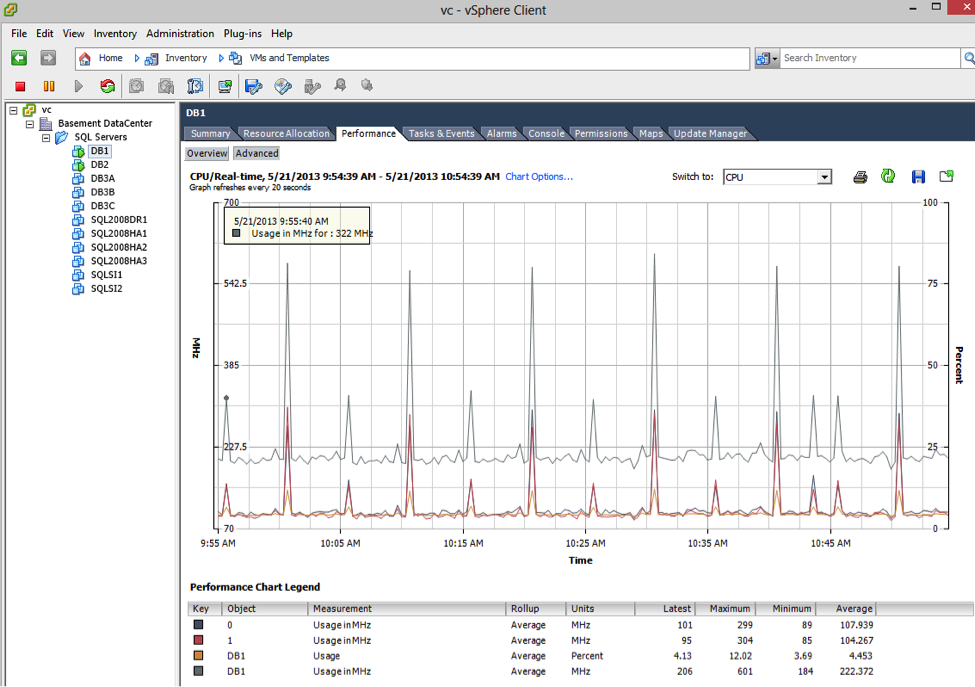
Now, for your DBAs, all you can see is that specific folder and the virtual machines contained underneath it. Select a virtual machine and then select Performance. You can now see all of the performance statistics that vCenter collects for these virtual machines.
However, I do not know of a good method to get you similar GUI access to the host-level statistics (the physical machines that your virtual machines are running on). What do you do if the VMware administrators refuse to grant you access to the infrastructure that will make or break the performance of your business-critical systems?
vCenter Database Access
OK. Now, you’re the DBA, right? Even though your VMware administrators might not grant you access to anything, you’ve got a tricky back-door at your fingertips. You have access to all databases in your environment so that you can configure and perform routine maintenance and health tasks. Guess what? VMware vCenter uses a database back-end to store all of these statistics. The most common back-end database installation underneath VMware vCenter is SQL Server.
Get the idea? Let’s get to the vCenter database itself and check out what we can see.
Now, I do not endorse going around your organization’s security policies and all that jazz. So – don’t break any rules or get yourself into trouble here! I only use these techniques in environments where this action has been approved by the appropriate entities.
First, find the vCenter database server. This should be located somewhere in your documentation. If the VMware administrators never asked you where to install the database for vCenter, a good chance exists that they used the native SQL Server Express click-through that comes as part of the installer.
Note: If SQL Server Express is found to be used, please set up proper database maintenance for this instance at this time. vCenter’s database server can be rebuilt if absolutely necessary, but the VMware administrators will have a bad week if this happens.
First, let’s look at some statistics that should match what you see within the virtual machine performance tab.
This query is related to a query recently released by Jonathan Kehayias from SQL skills, and was used as a base to extend the information presented into the vCPU level per virtual machine.
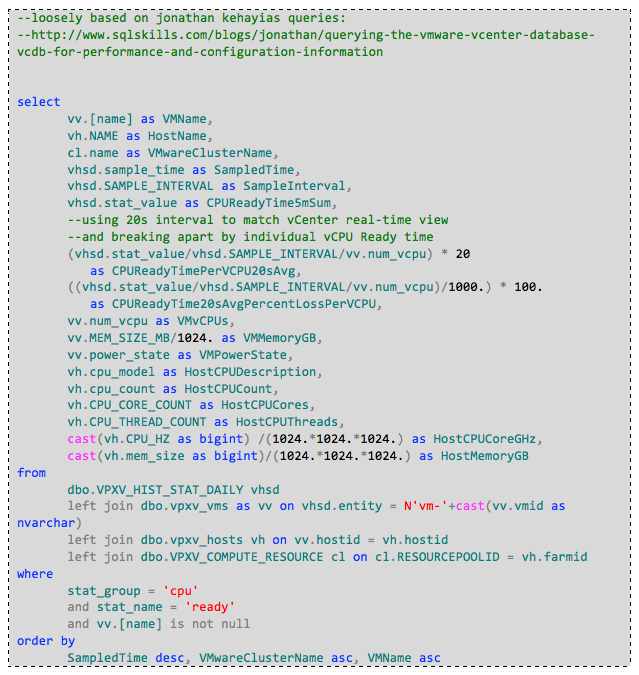
The output presents the following columns and values.
|
Column |
Notes |
|
VMName |
Virtual machine name (generally the same as the DNS name) |
|
HostName |
Physical server name that the virtual machines run on |
|
VMwareClusterName |
Logical VMware cluster name (group of hosts) |
|
SampledTime |
Time stamp of the collection date/time (generally every five minutes) |
|
SampleInterval |
Interval of data collection (generally five minutes, or 300 seconds) |
|
CPUReadyTime5mSum |
Sum |
|
CPUReadyTimePerVCPU20sAvg |
Average CPU ready time per VM vCPU per 20 seconds (same interval as performance tab real-time view) |
|
CPUReadyTime20sAvgPercentLossPerVCPU |
Percent raw CPU time lost per sample interval (resulting in some amount of performance degradation) |
|
VMvCPUs |
Number of virtual CPUs allocated to the VM |
|
VMMemoryGB |
Amount of virtual memory allocated to the VM |
|
VMPowerState |
VM power state (generally either on or off) |
|
HostCPUDescription |
CPU description as reported by the processor |
|
HostCPUCount |
Number of physical CPU sockets present |
|
HostCPUCores |
Number of physical CPU cores present |
|
HostCPUThreads |
Number of logical CPU threads (includes Hyper-threading, if applicable to CPU architecture) |
|
HostCPUCoreGHz |
Physical host CPU GHz per core |
|
HostMemoryGB |
Physical memory present in the host |
You are now free to start analyzing and/or archiving this data as you see fit. Remember, this data begins a rollup cycle starting at one day old within the vCenter database, so to maintain the granularity you might be interested in, consider archiving some or all of these statistics to another database for long-term analysis.
Next, let’s look at the state of the physical hosts in the environment. This is the layer that you currently cannot see from within the vCenter GUI.
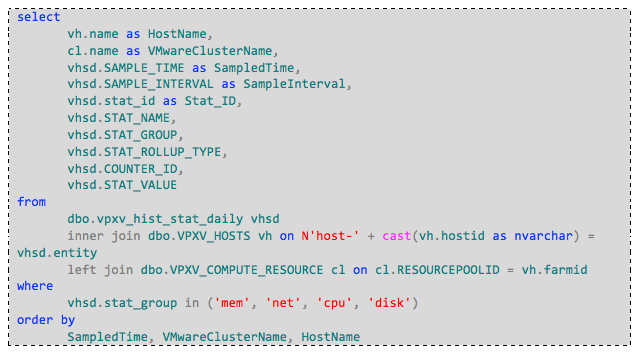
This query is quite a bit more simplistic than the previous query, and returns a lot of data. You are now presented with quite a number of statistics for each host in each cluster that is managed by this vCenter server. Feel free to use this query as a starting point for your own analytics of this data. Remember, do not report against the vCenter database. Copy the data elsewhere to report against or archive. Do not write anything that will block the normal day-to-day operations of vCenter, and never change anything in this database. Now you have the access that you need to help you troubleshoot the infrastructure if performance problems arise. Enjoy!